Simulation charts
Sometimes, just by watching the Simulation outcome is not enough to find out the bottleneck, especially when the diagram is large and have many, many bottlenecks. In such cases, you can produce charts for Simulation outcome, which helps quantify resource consumption and queuing time for each flow object.
To read the charts, click Simulation Charts in Simulation Control Panel.
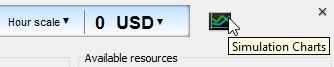 |
| Open Simulation Charts window |
Completion chart
The completion chart primarily shows the status of scenarios completion against time.
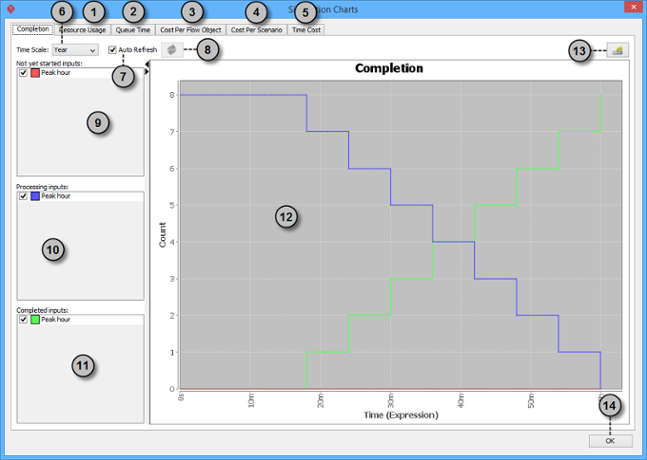 |
| An overview of completion chart |
|
|||||||||||||||||||||||||||||||||||||||||||||
| Description of completion chart |
Resource usage chart
The resource usage chart shows the percentage of resource consumption throughout simulation. If a resource has its peak reaching 100%, it means that the allocation of that resource is in optimum state. If the peak is below 100%, it means that some of the resources are not used throughout the simulation, which usually signifies that they are wasted, and you should consider to adjust the amount of available resource to optimize the resource consumption.
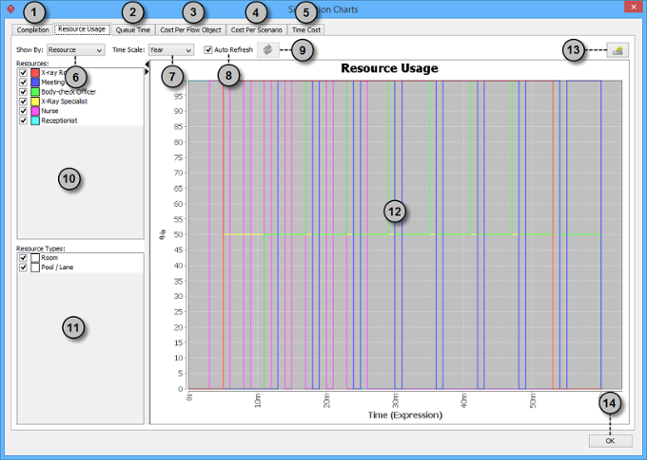 |
| An overview of resource usage chart |
|
|||||||||||||||||||||||||||||||||||||||||||||
| Description of resource usage chart |
Queue time chart
The queue time chart shows the time the flow objects spent on waiting, which corresponds to the time an inverted triangle appear during simulation. You may study whether the queue time of certain flow object is reasonable or not and think of the improvement.
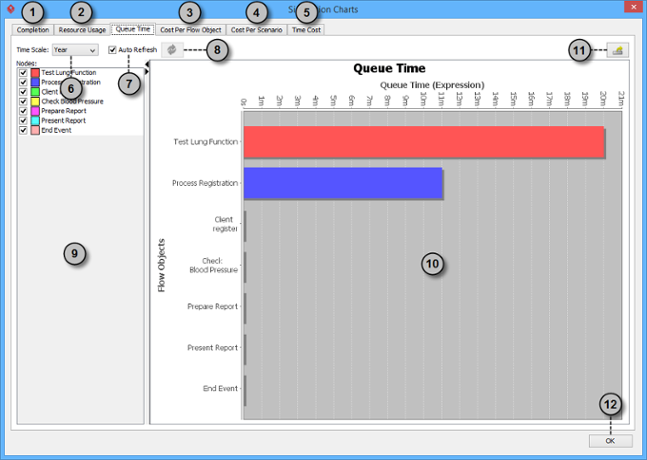 |
| An overview of queue time chart |
|
|||||||||||||||||||||||||||||||||||||||
| Description of queue time chart |
Cost per flow object chart
The cost per flow object chart shows the cost each flow object consumed throughout simulation.
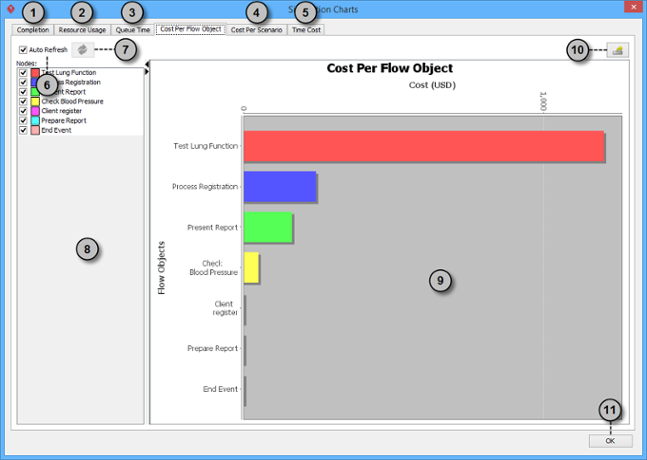 |
| An overview of cost per flow object chart |
|
||||||||||||||||||||||||||||||||||||
| Description of queue time chart |
Cost per scenario chart
The cost per scenario chart shows the cost each scenario consumed throughout simulation.
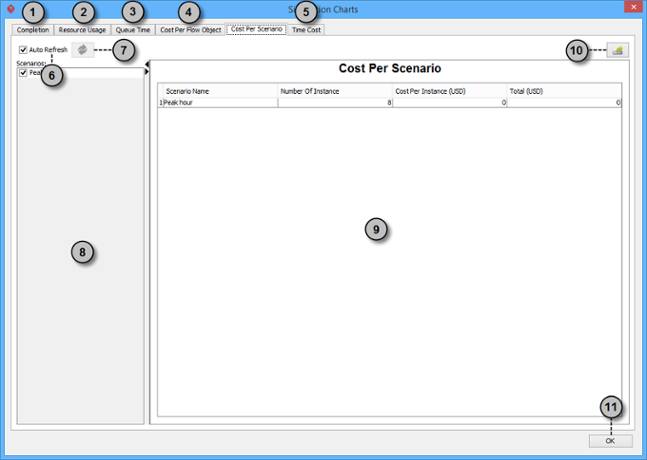 |
| An overview of cost per scenario chart |
|
||||||||||||||||||||||||||||||||||||
| Description of cost per flow object chart |
Time cost chart
The time cost chart shows the cost consumed against time spent throughout simulation.
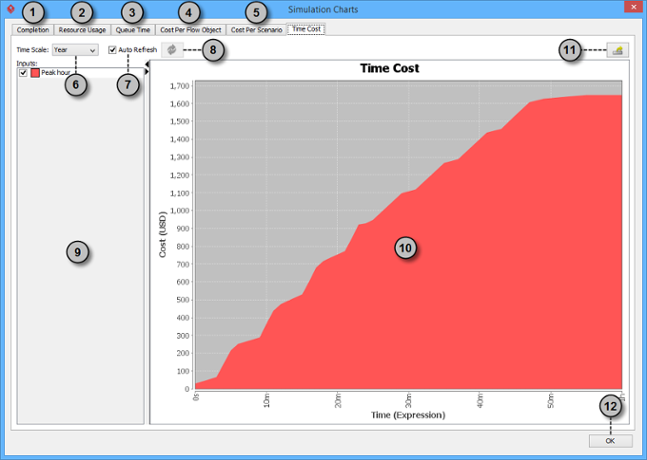 |
| An overview of time cost chart |
|
|||||||||||||||||||||||||||||||||||||||
| Description of cost per flow object chart |
| 3. Simulating business process | Table of Contents | Part XXIV. Zachman and BMM |