The Unified Modeling Language is a standardized general-purpose modeling language and nowadays is managed as a de facto industry standard by the Object Management Group (OMG). The creation of UML was originally motivated by the desire to standardize the disparate notational systems and approaches to software design. It was developed by Grady Booch, Ivar Jacobson, and James Rumbaugh at Rational Software in 1994–1995, with further development led by them through 1996.
Static modeling is used to specify the structure of the objects, classes or components that exist in the problem domain. These are expressed using class, object or component. While dynamic modeling refers to representing the object interactions during runtime. It is represented by sequence, activity, collaboration, and state. UML diagrams represent these two aspects of a system:
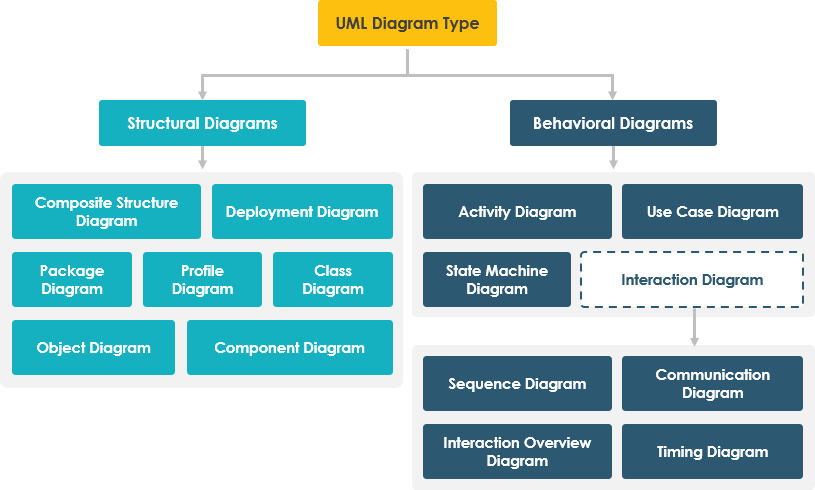
In UML 2.2 there are 14 types of UML diagrams, which are divided into these two categories:
These diagrams can be categorized hierarchically as shown in the following UML diagram map:
UML’s five behavioral diagrams are used to visualize, specify, construct, and document the dynamic aspects of a system. It shows how the system behaves and interacts with itself and other entities (users, other systems). They show how data moves through the system, how objects communicate with each other, how the passage of time affects the system, or what events cause the system to change internal states. Since behavior diagrams illustrate the behavior of a system, they are used extensively to describe the functionality of software systems. As an example, the activity diagram describes the business and operational step-by-step activities of the components in a system.
In other words, a behavioral diagram shows how the system works ‘in motion’, that is how the system interacts with external entities and users, how it responds to input or event and what constraints it operates under. There are seven behavioral diagrams that you can model the dynamics of a system as listed in the Table below:
| Behavioral Diagram | Brief Description |
| Activity Diagram | It is a graphical representations of workflows of stepwise activities and actions with support for choice, iteration and concurrency |
| Use Case Diagram | It describes a system’s functional requirements in terms of use cases that enable you to relate what you need from a system to how the system delivers on those needs. |
| State Machine Diagram | It shows the discrete behavior of a part of a designed system through finite state transitions. |
| Sequence Diagram | It shows the sequence of messages exchanged between the objects needed to carry out the functionality of the scenario. |
| Communication Diagram | It shows interactions between objects and/or parts (represented as lifelines) using sequenced messages in a free-form arrangement. |
| Interaction Overview Diagram | It depicts a control flow with nodes that can contain other interaction diagrams. |
| Timing Diagram | It shows interactions when the primary purpose of the diagram is to reason about time by focusing on conditions changing within and among lifelines along a linear time axis. |
Structure diagrams depict the static structure of the elements in your system. i.e., how one object relates to another. It shows the things in the system – classes, objects, packages or modules, physical nodes, components, and interfaces. For example, just as the static aspects of a house encompass the existence and placement of such things as walls, doors, windows, pipes, wires, and vents. The Seven UML structural diagrams are roughly organized around the major groups of things you’ll find when modeling a system.
Since structure diagrams represent the structure, they are used extensively in documenting the software architecture of software systems.
For example, the component diagram describes how a software system is split up into components and shows the dependencies among these components.
| Structural Diagram | Brief Description |
| Composite Structure Diagram | It shows the internal structure of a classifier, classifier interactions with the environment through ports, or behavior of a collaboration. |
| Deployment Diagram | It shows a set of nodes and their relationships that illustrates the static deployment view of an architecture. |
| Package Diagram | It groups related UML elements into a collection of logically related UML structure. |
| Profile Diagram | |
| Class Diagram | It shows a set of classes, interfaces, and collaborations and their relationships, typically, found in modeling object-oriented systems. |
| Object Diagram | It shows a set of objects and their relationships, which is the static snapshots of instances of the things found in class diagrams. |
| Component Diagram | It shows a set of components and their relationships that illustrates the static implementation view of a system. |