
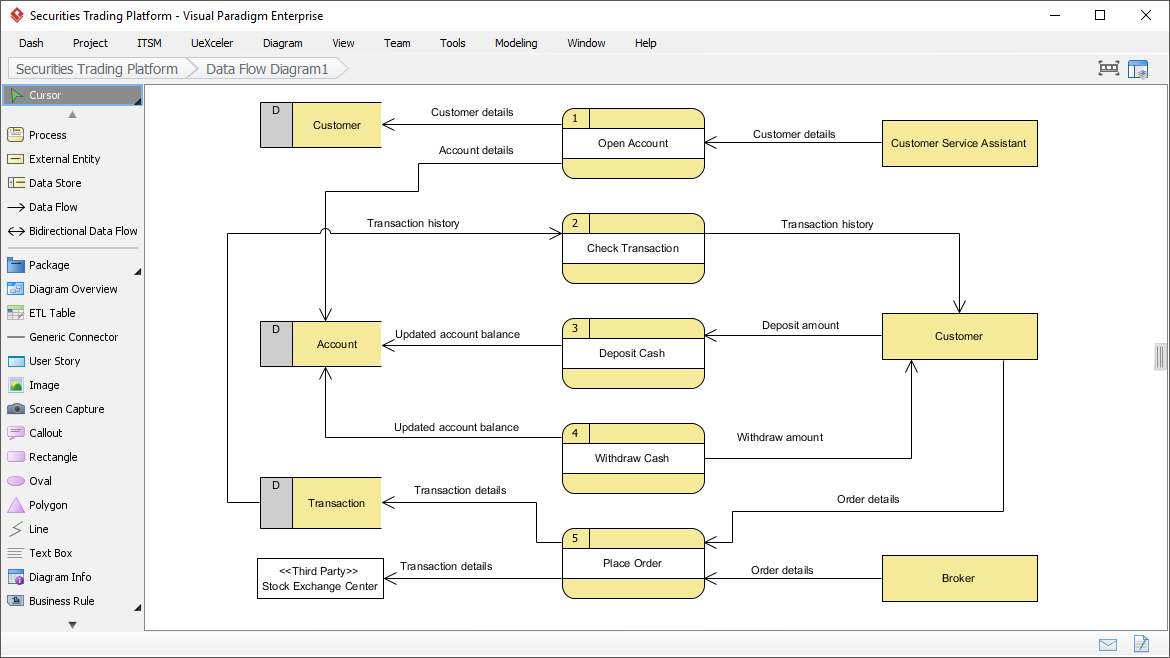
Data flow diagram (DFD) projects an overview of an information system through representing the production and receive of 'data'. Visual Paradigm features all the DFD tools you need to draw professional DFD and generate complete DFD specification. You can also link up your DFD and business process diagram (BPD) for connecting your system processes and business activities.
As an award-winning modeling software, Visual Paradigm supports a wide variety of standards and popular diagram types, supporting your modeling needs from the beginning of your project, to the end.
Believe Us! You Will Love Visual Paradigm's Solutions -- But You Be the Judge.
Schedule a DemoWe are trusted by over 320,000 people in companies ranging from small business to Fortune 500 companies, universities and government units.

