How to Draw Event-Driven Process Chain Diagram (EPC Diagram)?
EPC diagram, abbreviation for event-driven process chain diagram, is a flowchart based diagram that can be used for resource planning and identifying possible improvements of a business process.
|
|
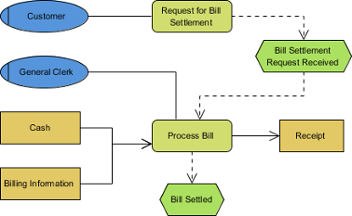
| A sample EPC diagram |
Creating EPC diagram
- Select Diagram > New from the application toolbar.
- In the New Diagram window, select EPC Diagram.
- Click Next.
- Enter the diagram name and description. The Location field enables you to select a model to store the diagram.
- Click OK.
Notations
|
||||||||||||||||||||||||||||||||||||
| A list of supported notations in EPC diagram |

Applying stereotype to EPC elements
A stereotype defines how a model element may be extended. It also enables the use of platform or domain specific terminology or notation in place of or in addition to the one used for the extended metaclass. You can apply one or more stereotypes to model elements and decide whether or not to visualize the stereotype or tagged values in views. To apply stereotype to model element:
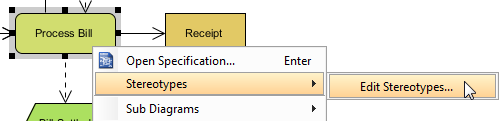
- Right click on the model element or the view of the model element that you want to apply stereotype to. Select Stereotypes > Stereotypes... from the pop-up menu. As a side note for you, once you have ever applied a stereotype on the selected kind of element, you can re-select the same stereotype in this popup menu.
Open Stereotypes page - In the model element specification, open the Stereotypes tab and then click on Edit Stereotypes....
- In the Configure Stereotypes dialog box, click Add....
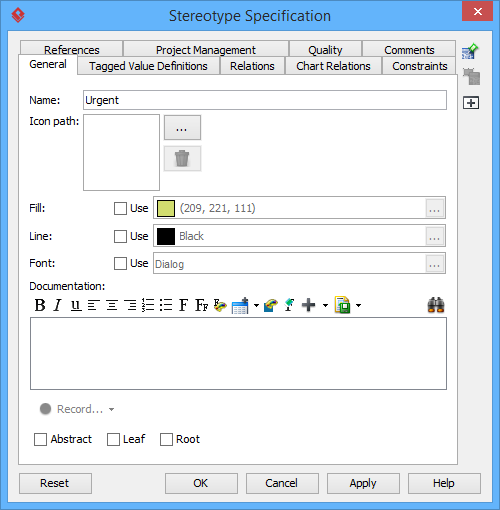
- In the Stereotype specification dialog box, enter the name of stereotype and click OK.
Naming stereotype - This goes back to the specification dialog box. Select the stereotype you want to apply, then click > to assign it to the Selected list.
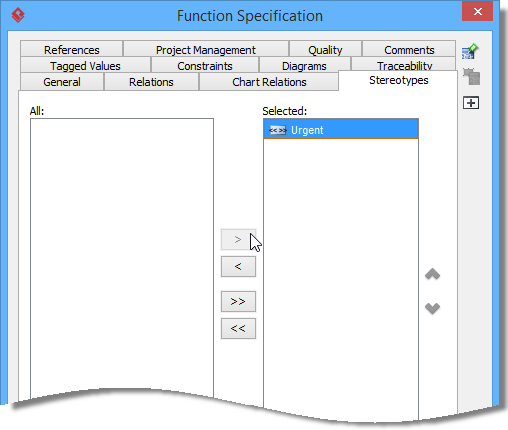
Selecting stereotype NOTE: You can also double click on a stereotype to apply it. NOTE: While clicking on > applies the selected stereotype to model element, clicking on < removes a stereotype selected in Selected list.
To apply all available stereotypes to model element, click on >> and likewise, clicking on << to remove all the applied stereotypes.
- Click OK to confirm. The stereotype will then be shown within a pair of guillemets above the name of the model element. If multiple stereotypes are applied, the names of the applied stereotypes are shown as a comma-separated list with a pair of
guillemets.
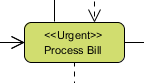
Stereotype is applied to element
Changing the navigability of an information flow
By default, arrow head is shown at the to-side of an information flow, representing a flow in "to" direction. If you want to represent that the flow has no direction, to flow back to the from end or flow in both sides, perform the steps below:
- Right click on the information flow and select Open Specification... from the popup menu.
- In the Information Flow Specification window, set Direction to None/From/Both.
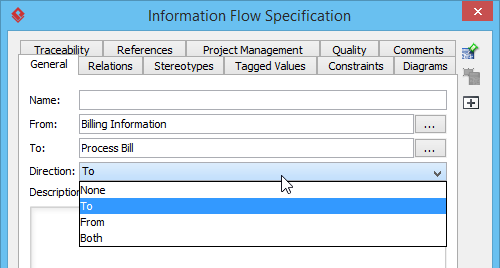
Setting the direction of an information flow - Click OK to confirm the change. The diagram is updated.
Related Resources
The following resources may help you to learn more about the topic discussed in this page.
| Chapter 2. Event-driven Process Chain Diagram | Table of Contents | Chapter 3. Process Map Diagram |