How to Create a RACI Chart?
Visual Paradigm enables you to build a chart. In addition to the built-in RACI chart available for general purposes, you can define your own type of chart for problem-specific purposes. In this page, you can learn how to develop a chart, define color for roles and define a new code type.
Developing a chart
- Select Modeling > Import Analysis > Chart from the toolbar.
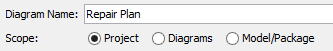
- Name the chart diagram.
Name the chart diagram - Select a model element type for row and column respectively to identify which participant is involved in an activity.
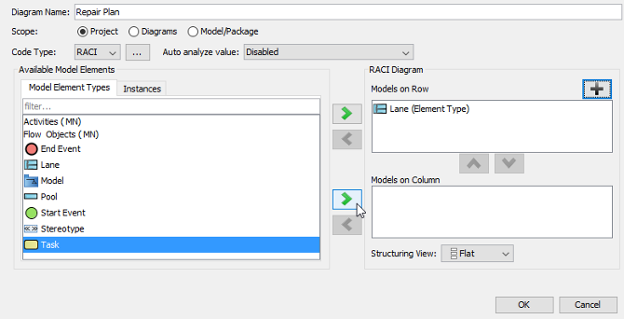
Select a model element type for row and column NOTE: The choice of model element types will be in accordance with your exisiting model elements in the same project. - Select the Structuring View. The Flat view lists elements at single level, while the directory view lists elements in a hierarchy, following their placement in model structure.
- Click OK button.
- You can then assign the role to participant(s) by clicking Mark Code to Cell button on the top of chart.
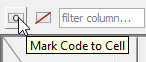
Click Mark Code to Cell button - When the roles reveal, click the target role and select the target cell to assignment.
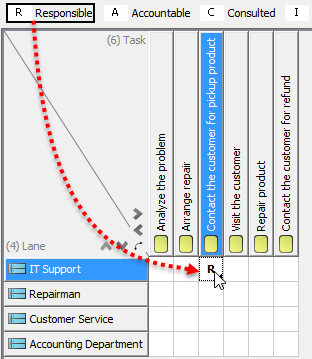
Assign role
Adding an item
Apart from selecting the existing model elements on chart, you can also create objects without model view. Those objects will have the similar properties with model elements that you can assign role to them.
To create an item without model view:
- Right click on a model element where you want to insert an item in font of that model element and select Add item... from the pop-up menu.
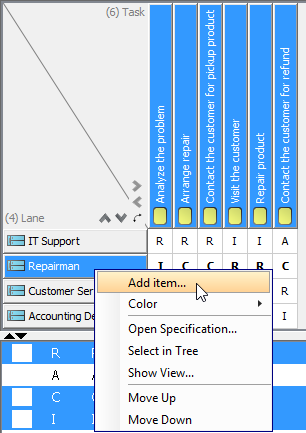
Add an item - Enter name for new item in the pop-up Input dialog box. Click OK button to confirm and close the dialog box.
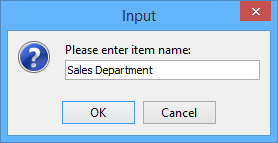
Enter item's name
As a result, the newly created item is shown.
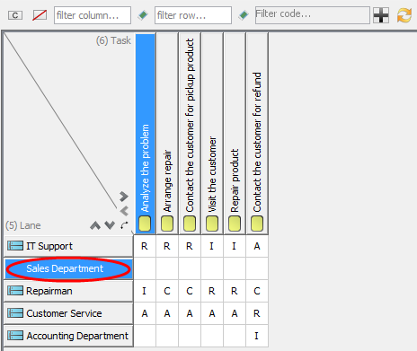
The newly created item is shown
Specifying background color for column/ row
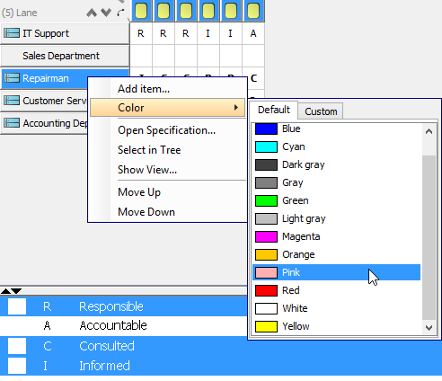
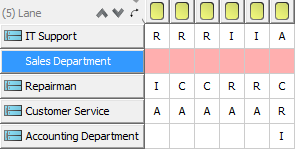
The background color of columns and rows are white by default. You can specify background color for the entire columns/ rows by right clicking on the target row/ column and then selecting color for it.
To set background color for column/ row:
Right click on the target row/ column and select Color > [target color] from the pop-up menu. You can select a color from either Default category or Custom category.
 |
| Select a background color |
As a result, the background color for selected row/ column is set.
 |
| Background color is set |
Opening model element's specification
You can view and specify the properties of model elements by opening their specification dialog box.
To open a model element's specification:
- Right click on the target model element and select Open Specification... from the pop-up menu.
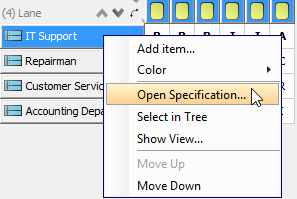
Open Lane's Specification dialog box - In specification dialog box, specify its properties, for example, description, references, tagged values and comments. Click OK button.
Showing the view of model element
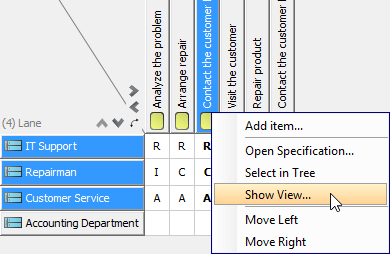
When reading the chart, you may want to view the model element on its source diagram.
You can view the model element by right clicking on the target model element and selecting Show View... from the pop-up menu.
 |
| Show the view of model element |
As a result, the view of model element is selected on the diagram.
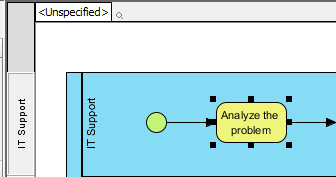 |
| Model element is selected on its source diagram |
Reordering row/ column
You can arrange the order of model elements with your preference.
Right click on target row/ column and select Move up or Move Down from the pop-up menu.
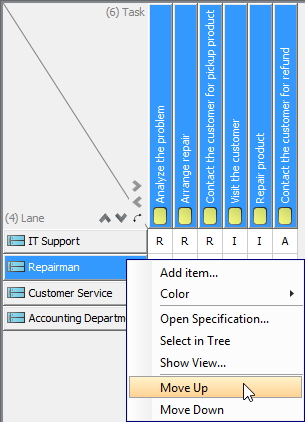 |
| Move the model element up |
Defining color for roles
- To define a color for roles, you can modify the existing code type by clicking the … button of Code Type in Chart Diagram.
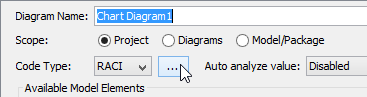
Define code type - To define a color for a role, click the target role you want to change its color on the left, click the ... button next to Color and select a color from the pop-up menu.
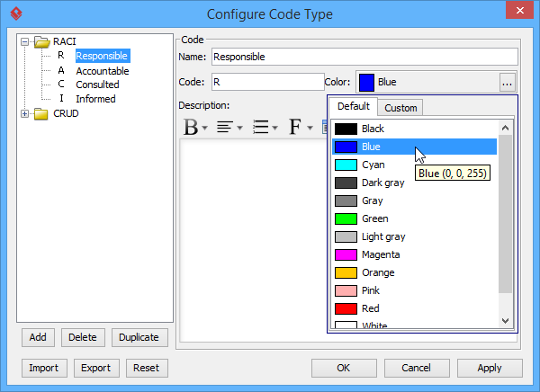
Select a color for target role - Click OK button.
Defining a new code type
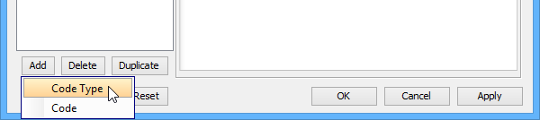
- In Chart Diagram, apart from the built-in code type, you can configure a new code type by clicking the … button of Code Type.
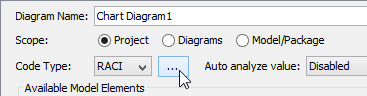
Define a new type of chart - In the pop-up Configure Code Type dialog box, select Add > Code Type from the pop-up menu at the bottom to add a code type.
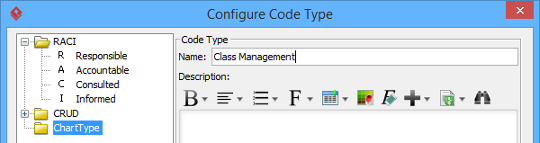
Add a code type - Rename the newly created code type in Name.
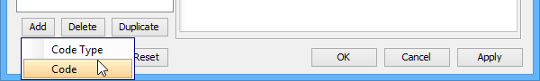
Rename the code type - To configure the roles under the new code type, select Add > Code from the pop-up menu.
Add a new code - Enter the name of the code in Name and a letter which presents the code in Code. Click the … button next to Color and select a color for the code from the pop-up menu.
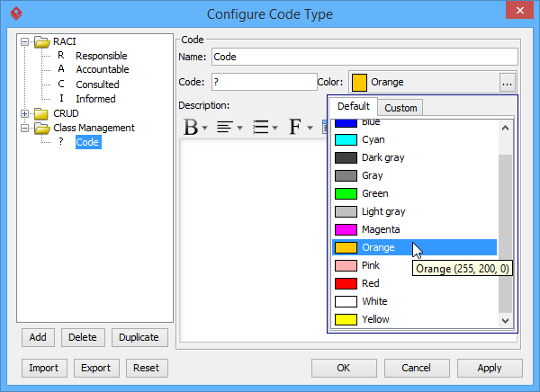
Enter the properties of code - Click OK button.
- The chart type you created previously is currently available from the combo box of Code Type. Select it from the combo box of Code Type.
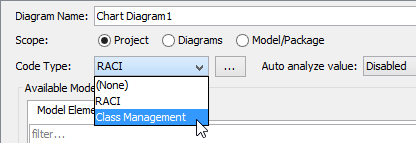
Select a code type from the combo box of Code Type
Related Resources
The following resources may help you to learn more about the topic discussed in this page.
| Chapter 4. Chart Diagram | Table of Contents | Part XVIII. CMMN toolset |