Drawing BPMN Business Process Diagram
Business Process Model and Notation (BPMN) is a graphical representation for designing and modeling business processes visually. It is a standard for business process modeling and provides a graphical notation for specifying business processes in a Business Process Diagram (BPD).
|
|
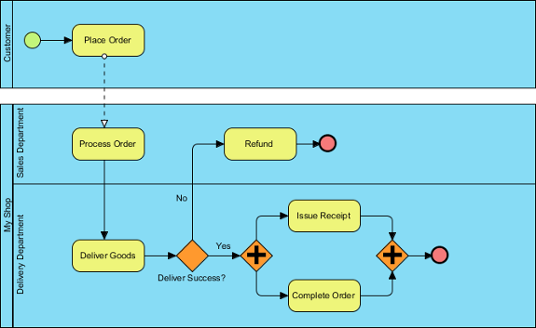
| A sample Business Process Diagram |
Creating BPMN Business Process Diagram
- Select Diagram > New from the application toolbar.
- In the New Diagram window, select Business Process Diagram.
- Click Next.
- Enter the diagram name and description. The Location field enables you to select a model to store the diagram.
- Click OK.
Assigning IDs to model elements
It is possible to assign IDs to objects in business process diagram. By default, IDs are assigned by following the order of object creation, starting from number 1. However, you can define the format or to enter an ID manually.
ID can be useful in documenting a business workflow in business process modeling in that it provides a way to uniquely identify business activities in workflows.
Defining the format of ID
To define the format of ID, open the Project Options window by selecting Windows> Project Options from the toolbar. Select Diagramming from the list on the left hand side and open the Model Generation tab. Click Add and then select the type of model element that you want to change its ID format (E.g. Task). Then, you can adjust the format, say to specify the prefix, the number of digits and suffix.
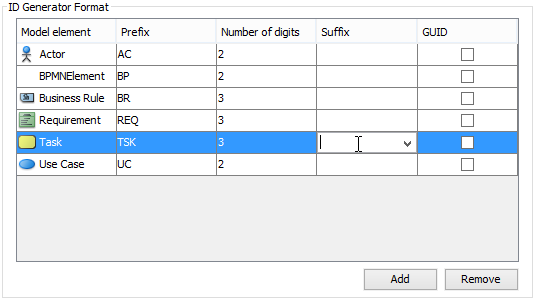 |
| Defining format of ID |
Below is a description of the options.
|
||||||||||
| Options for formatting ID |
Controlling how ID is shown on new diagram
By default, ID is just a text property that won't appear in diagram. However, you can make it appeared either near or within a shape.
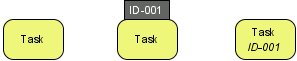 |
| Different looks of a BPMN task when ID is not shown, ID is shown as label and ID is shown below caption |
To define the way ID is shown in BPD, open the Project Options window by selecting Window > Project Options from the toolbar. Select Diagramming from the list on the left hand side and open the Business Process > Behavior tab.
In the ID Generator Format section, select whether or not to show ID on diagram and whether to show it as a label that is attached to a shape or as text below caption. If you select Show as Customized, you can edit in the table of model element the way ID is shown.
Note that the setting is effective only in newly created diagrams.
Controlling how ID is shown on an existing diagram
The previous section described how to set the appearance of ID in new diagrams. Here, you can see how to change the ID appearance of an existing diagram.
To do this, right click on the BPD you want to edit and select Presentation Options > Configure Show ID Options... from the pop-up menu.
In the Configure Show ID Options window, click on the drop down menu Show ID Option and select if you want to show IDs. If yes, select where to show, such as below caption or as a label.
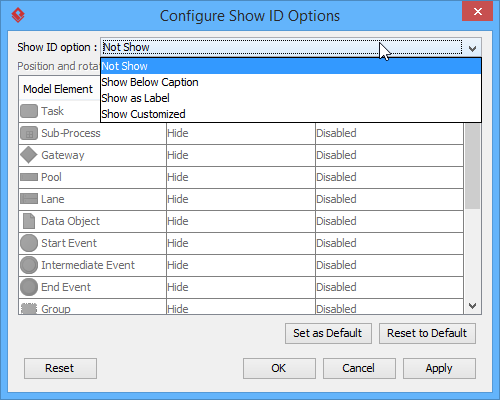 |
| To configure the whether or not to show ID |
If you have selected to show as label, you can adjust in further the position of ID, relative to the shape (e.g. Top right of task) and the rotation.
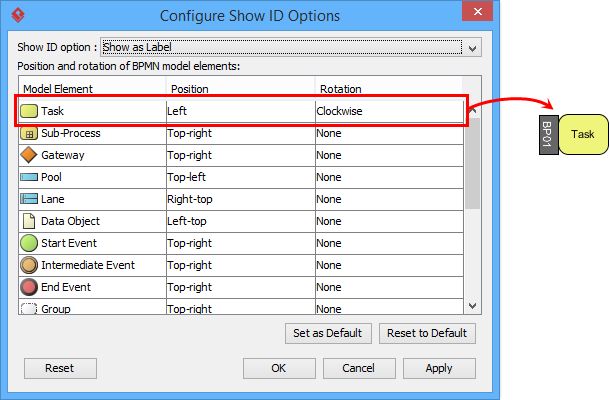 |
| To make ID of task show as label, position at the left of shape |
ID assignment
There are several ways that you can assign an ID to an element, including:
- Through the specification dialog box (Right click on it and select Open Specification... from the popup menu)
- Through the ID label (available only when ID is shown as label on diagram)
- Through the Property Pane
Nested ID
When you draw something in a lane/pool or to drill down a sub-process into another level and draw something, this forms a nested element hierarchy like a task is contained by its parent pool. ID is formed nested according to the hierarchy. For instance, while a pool has '3' as ID, its children have 3.1, 3.2... as IDs. You can turn this function on and off.
To turn on or off, right click on a BPD and select Diagram Content > Edit IDs... from the popup menu. At the bottom of the dialog box, check or uncheck the option Sub-Level ID.
Showing process statistic
Process statistic refers to the results of the statistical analysis that can be conducted upon your process. There are three types of figures: number of message flows, total process-costs and the total processing hours.
To show process statistic:
- Right click on the background of the Business Process Diagram.
- Select Utilities > Show Statistic... from the popup menu. This opens the Statistic window like this:
Below is a description of figures.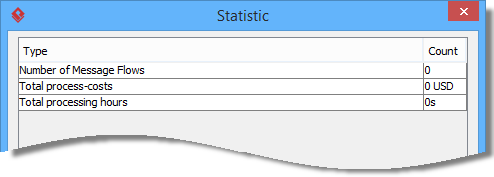
Process statistic
Figure Description Number of Message Flows The number of message flows that exist in the current diagram. Total process-costs A summation of costs specified for tasks and sub-processes in the current diagram. Total processing hours A summation of duration specified for tasks and sub-processes in the current diagram. Description of figures in process statistic
Related Resources
The following resources may help you to learn more about the topic discussed in this page.
| Chapter 1. Business Process Diagram | Table of Contents | 2. Pool and lane |