Communicate business process ideas with professional BPMN tool.

Business Process Model and Notation (BPMN) provides a graphical representation of business workflows that anyone, from business analyst to stakeholder, can easily understand; aiding in business process analysis and business process improvements. Visual Paradigm features an intuitive BPMN 2.0 modeler that lets you create professional Business Process Diagram quickly and smoothly.


"Open up" a sub-process and model the lower level of process flow in another business process diagram. Our BPMN tool lets you easily collapse sub-process to hide the details, or expand it to view the lower-level process flow.
As an all-rounded visual modeling tool, we support not only a set of diagrams, but the capability to integrate them in maximizing the effectiveness of visual modeling. In a process design you can map the process flow with other modeling artifacts such as UML shapes, ERD entities, wireframes, etc.


While a BPD represents a bird's eye view of a business process, the operational procedures of individual business activity can be further specified in the working procedure editor. Moreover, you can output a process specification that contains both the process diagram and the working procedure, and share it among the team as a guideline of work.
Produce a target process model (i.e. To-be) from the baseline (i.e. As-is), and start editing the target to represent the expected result of process improvement/re-engineering. Traceability is maintained in background, which enables you to navigate through the two models smoothly.

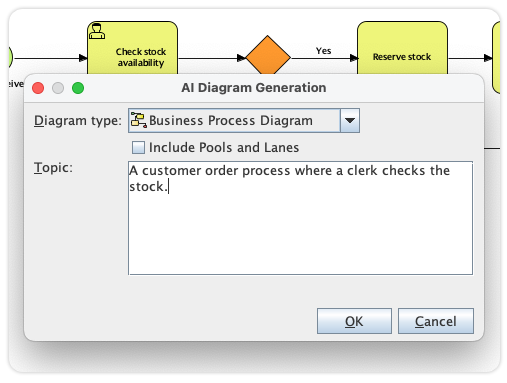
Visual Paradigm's diagram editor is the go-to tool for documenting organizational workflows with precision. We've taken this further by integrating our AI Diagram Generator directly into the business process environment. Now, you can move from a rough operational concept to a fully structured BPMN-compliant diagram in seconds, allowing your team to focus on optimization rather than manual drawing.
Instead of hunting for symbols or manually organizing lanes, you simply provide a plain-English description to our AI-powered engine. Whether you're mapping a customer journey or a complex supply chain, the AI-powered logic interpretation instantly builds the sequence of tasks, gateways, and hand-offs. This provides business analysts with an immediate, high-quality AI-powered foundation that is ready for deep analysis, stakeholder discussion, and organizational implementation.

RACI chart is a matrix that presents the different responsibilities of diverse people, teams, departments or any other business units in completing business activities. RACI chart involves rows of participants and columns of business activities. When appropriate, cells are marked with letters R, A, C or I with each of them representing a specific kind of responsibility namely Responsible, Accountable, Consulted and Informed. Besides RACI Chart, you can also create CRUD Chart, or any custom chart.
Instantly form an RACI chart from a Business Process Diagram (BPD), and with responsibility 'R' automatically assigned based on the process content.
Instantly form a CRUD chart from a BPD to indicate the creation, read, update or deletion of data objects.
Make your business process design alive! The animation tool clears barrier encountered in studying process flow with static images. It analyzes process flows and converts process design into an animation, which can be viewed in motion by you, your clients and colleagues.

Visually simulate execution of business process for studying the resource consumption (e.g. human resources, devices, etc.) throughout a process, evaluate cost, identify bottleneck, trial run the possible process improvement options being implementing in real-world business.

Specify the resource required to execute a business process, and the resource required by each task and sub process.
Simulate business process in real time, minute scale, hour scale or day scale to see the whole execution timeline.
Specify the cost per task and sub process. Select a currency and evaluate the cost in total.
Identify the status of inputs completion against time.
Identify the consumption of resources by different business activities throughout the process execution.
Shows the time the flow objects spent on waiting, which helps a lot in identifying the bottleneck of process.
* As-is and To-be Process, RACI & CRUD chart, process animation & simulation are available in Visual Paradigm Standard, Professional and Enterprise only.