UML State machine diagram and activity diagram are both behavioral diagrams but have different emphases. Activity diagram is flow of functions without trigger (event) mechanism, state machine is consist of triggered states.
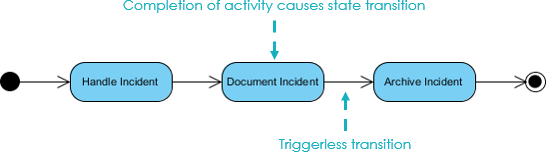
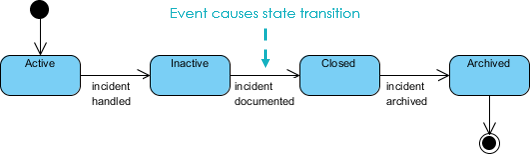
People often confuse state diagrams with flowcharts. The figure below shows a comparison of a state diagram with a flowchart. A state machine diagram in the Figure on the left below performs actions in response to explicit events. In contrast, the Activity diagram in the Figure of the right below does not need explicit events but rather transitions from node to node in its graph automatically upon completion of activities.

Are you looking for a Free UML tool for learning UML faster, easier and quicker? Visual Paradigm Community Edition is a UML software that supports all UML diagram types. It is an international award-winning UML modeler, and yet it is easy-to-use, intuitive & completely free.
Free DownloadA state diagram (also called state machine diagram, statchart and start transition diagram) is a type of diagram behavior diagram in UML. In most OO techniques, state diagrams are drawn for a single class to show the lifetime behavior of a single object. They describe all of the possible states that a particular object (or even the entire system) can get into. State Machines give us the means to control decisions and each state is like a 'mode of operation' for the object which behaves differently depending on its state.

Activity diagrams describe activities which involve concurrency and synchronization, which are a variation of state diagrams that focuses on the flow of actions and events. They can be used for:
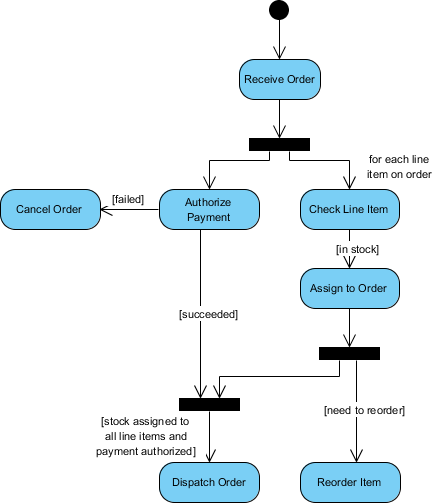
In UML semantics, Activity Diagrams are reducible to State Machines with some additional notations that the vertices represent the carrying out of an activity and the edges represent the transition on the completion of one collection of activities to the commencement of a new collection of activities. Activity Diagrams capture high level activities aspects. In particular, it is possible to represent concurrency and coordination in Activity Diagrams.
Take a look at the Activity Diagram which models the flow of actions for an incident. Such an Activity Diagram focuses on the flow of data within a system.
In State Machines the vertices represent states of an object in a class and edges represent occurrences of events. The additional notations capture how activities are coordinated. Objects have behaviors and states. The state of an object depends on its current activity or condition. A State Machine Diagrams shows the possible states of the object and the transitions that cause a change in state.
Take a look at the State Machine Diagram below. It models the transitioning of states for an incident. Such a state diagram focuses on a set of attributes of a single abstraction (object, system).
You've learned what a State Machine Diagram is and how to draw a State Machine Diagram. It's time to draw a State Machine Diagram of your own. Get Visual Paradigm Community Edition, a free UML software tool, and create your own State Machine Diagram with the free State Machine Diagram tool. It's easy-to-use and intuitive.
Free Download