使用我们的免费 ECharts 编辑器将数据转化为令人惊艳的视觉效果
通过首屈一指的在线 ECharts 编辑器 VPasCode,让您的数据栩栩如生。我们智能且免费的 ECharts 工具提供实时呈现功能,让您以无与伦比的轻松度与精确度,设计出引人入胜的柱状图、折线图、饼图等。
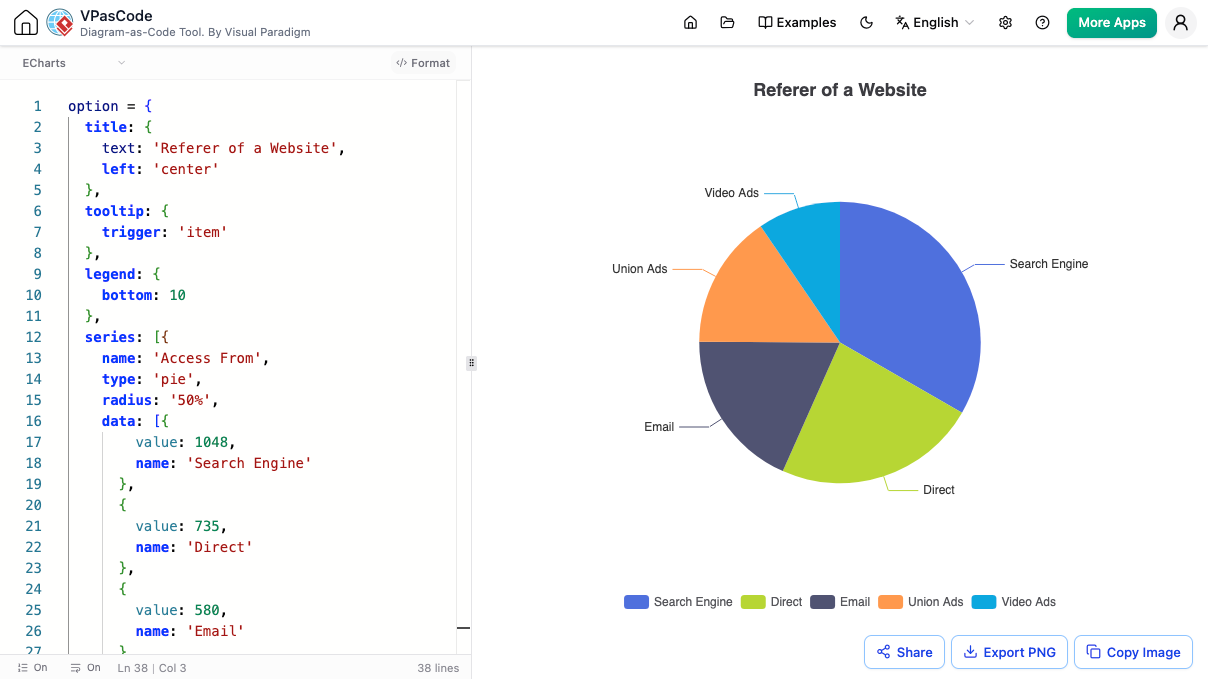
在设计 ECharts 可视化时遇到困难吗?
如果没有即时反馈,配置复杂的 ECharts 选项可能会耗费大量时间。您需要一个专属的 ECharts 编辑器,它能提供实时可视化、简化您的工作流程,并协助您掌握强大的 ECharts API。
您的实时 ECharts 设计工作室
我们的 ECharts 工具专为精确度与创造力而打造。构建动态交互图表(从简单的柱状图到复杂的多系列可视化),并在您调整 ECharts 选项时实时观看其呈现。
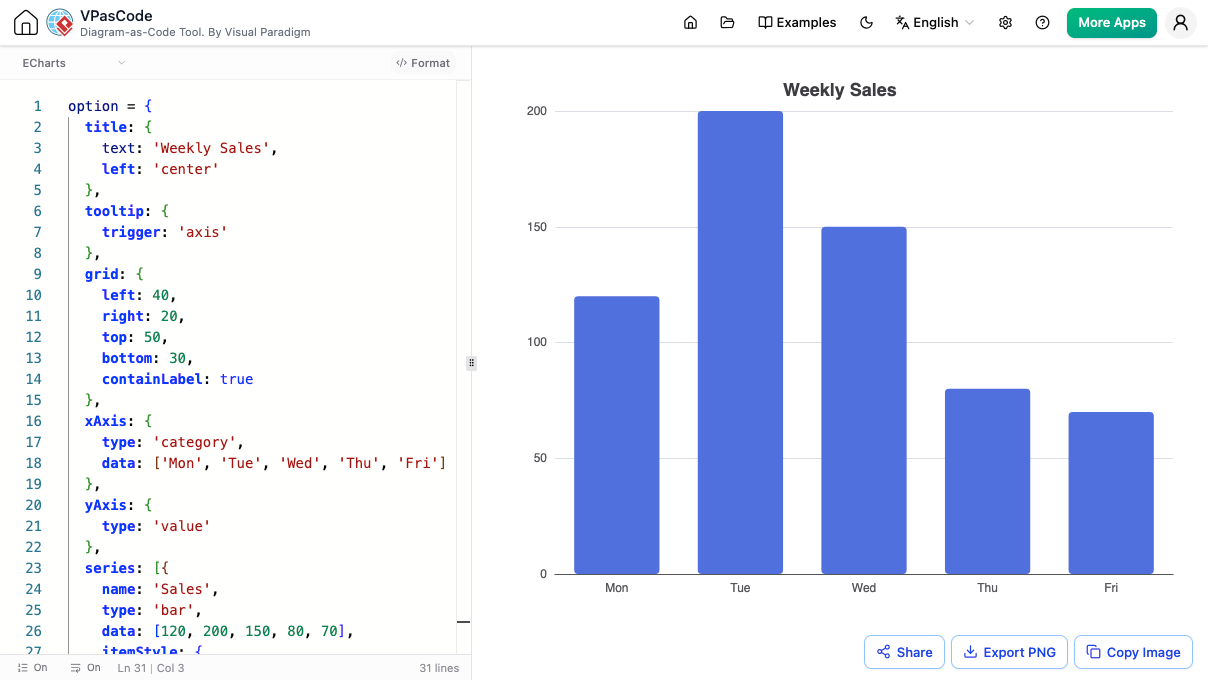
在文本转图表编辑器中编辑 EChart 分组柱状图 - VPasCode
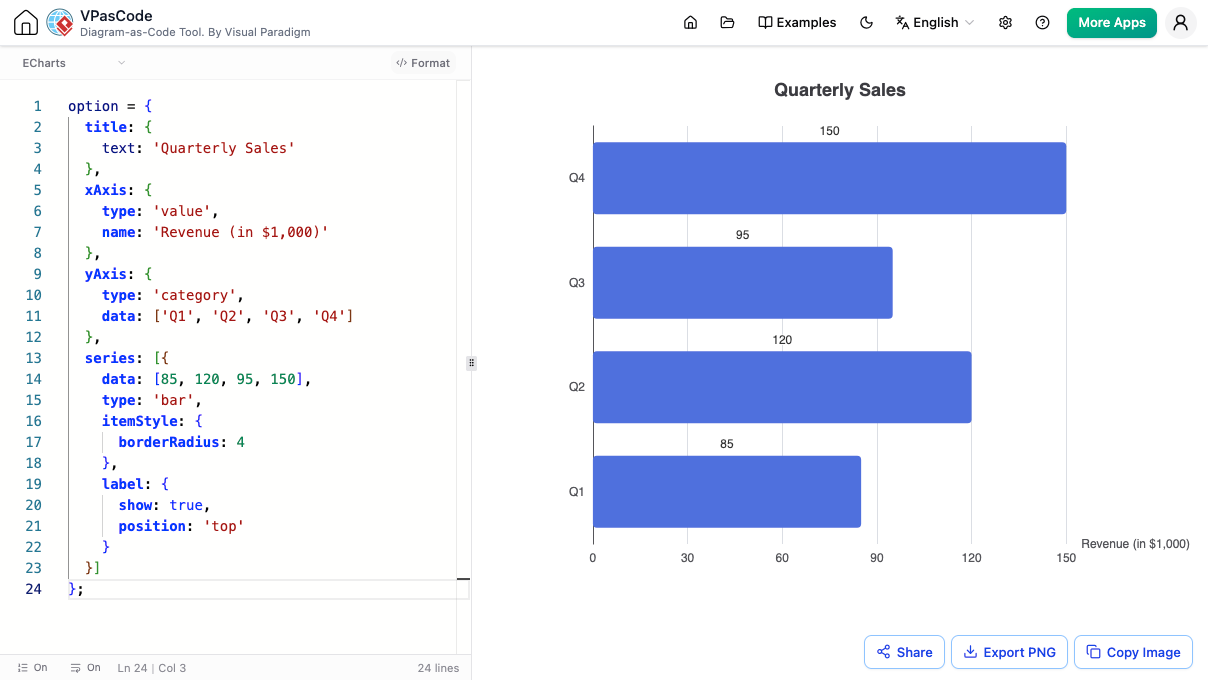
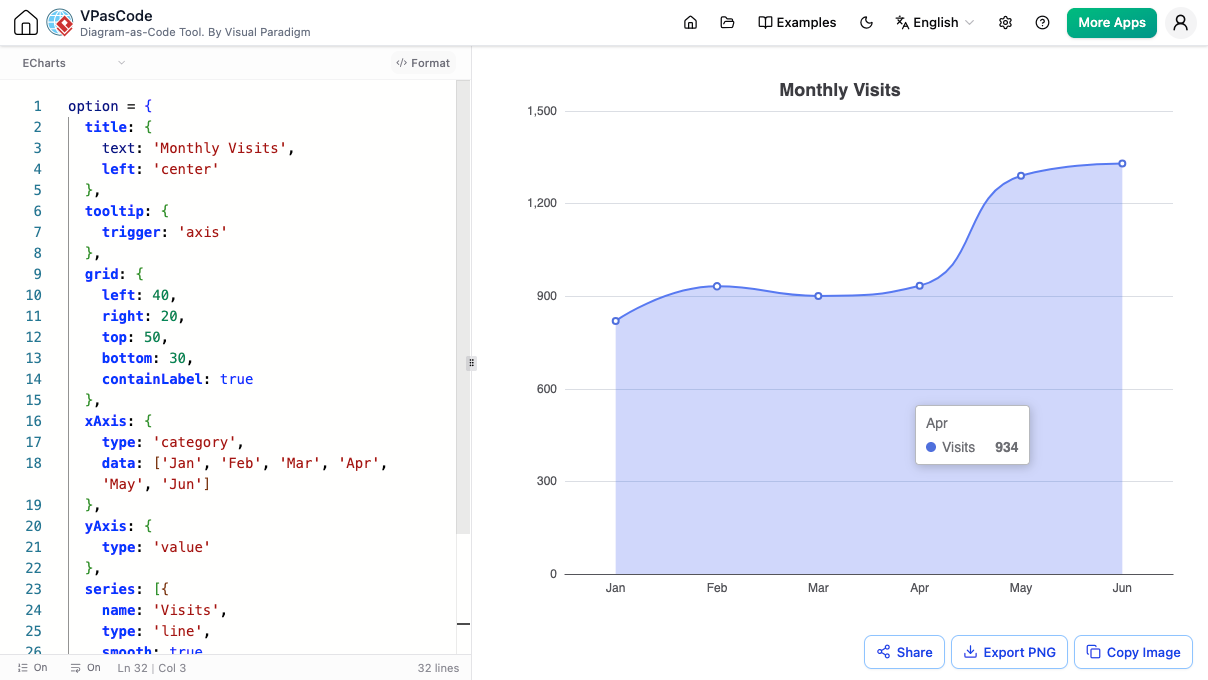
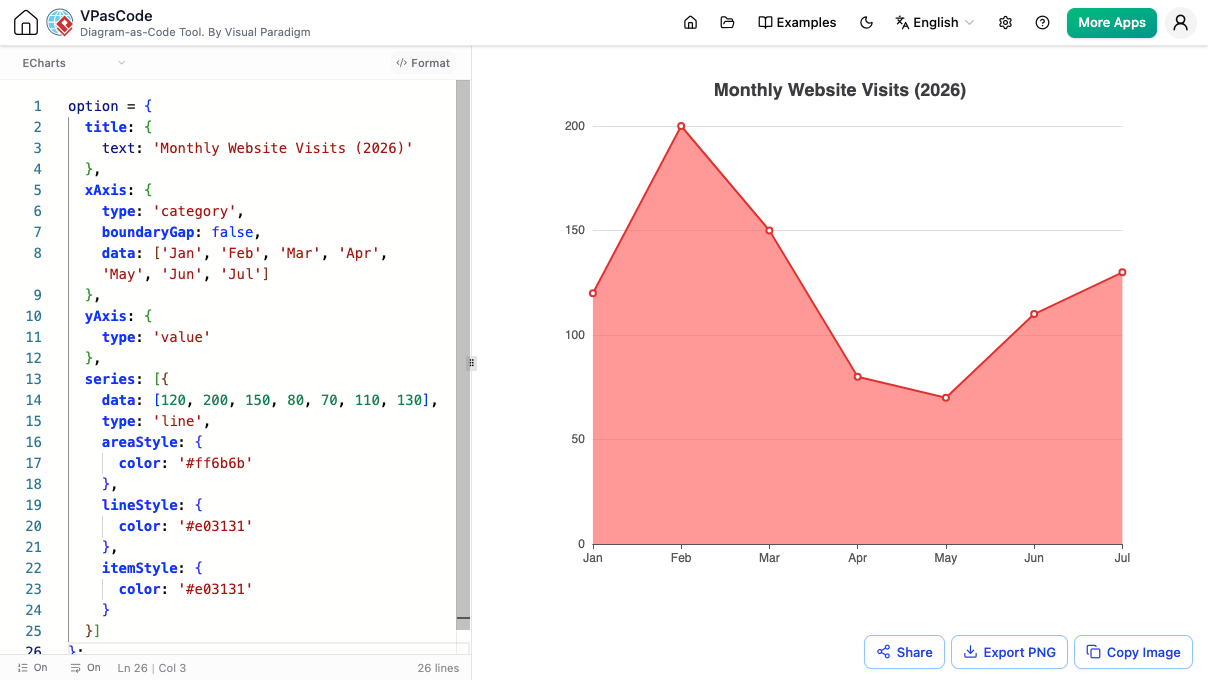
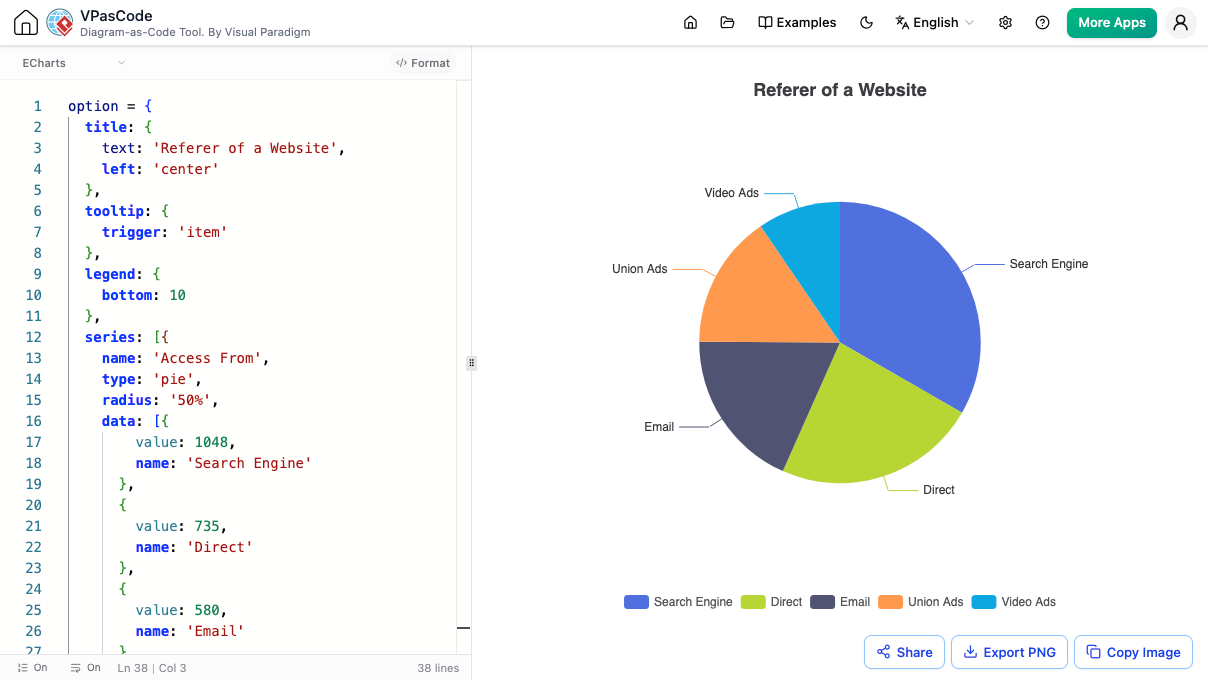
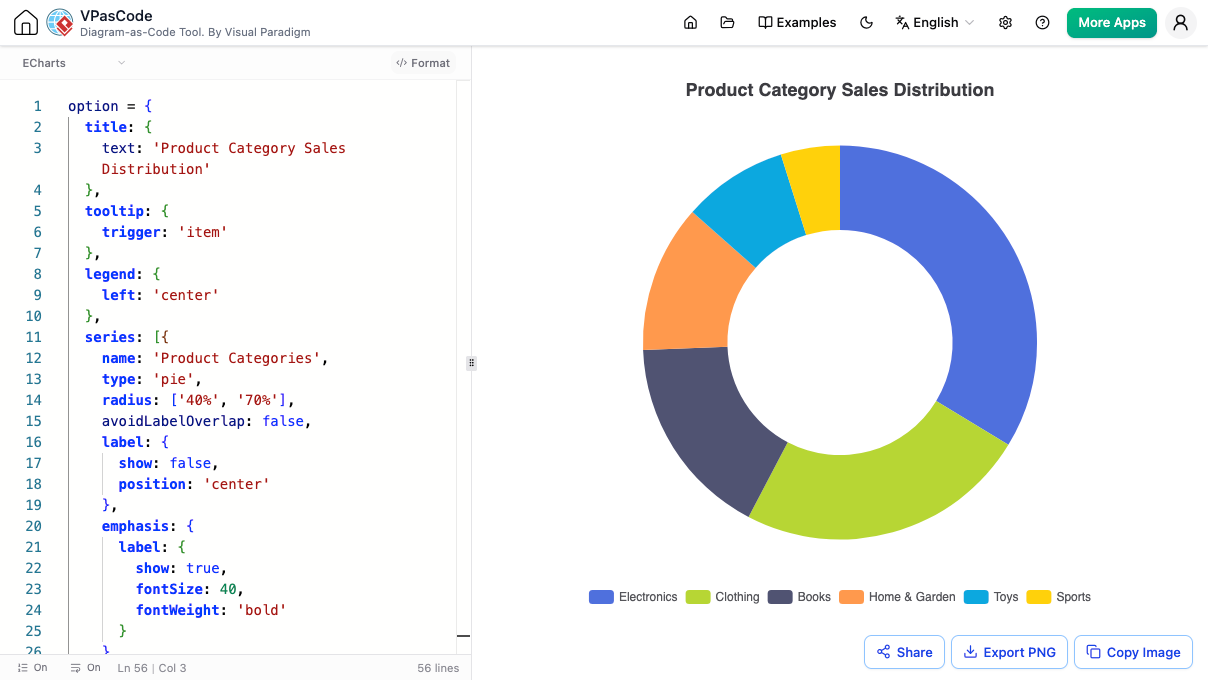
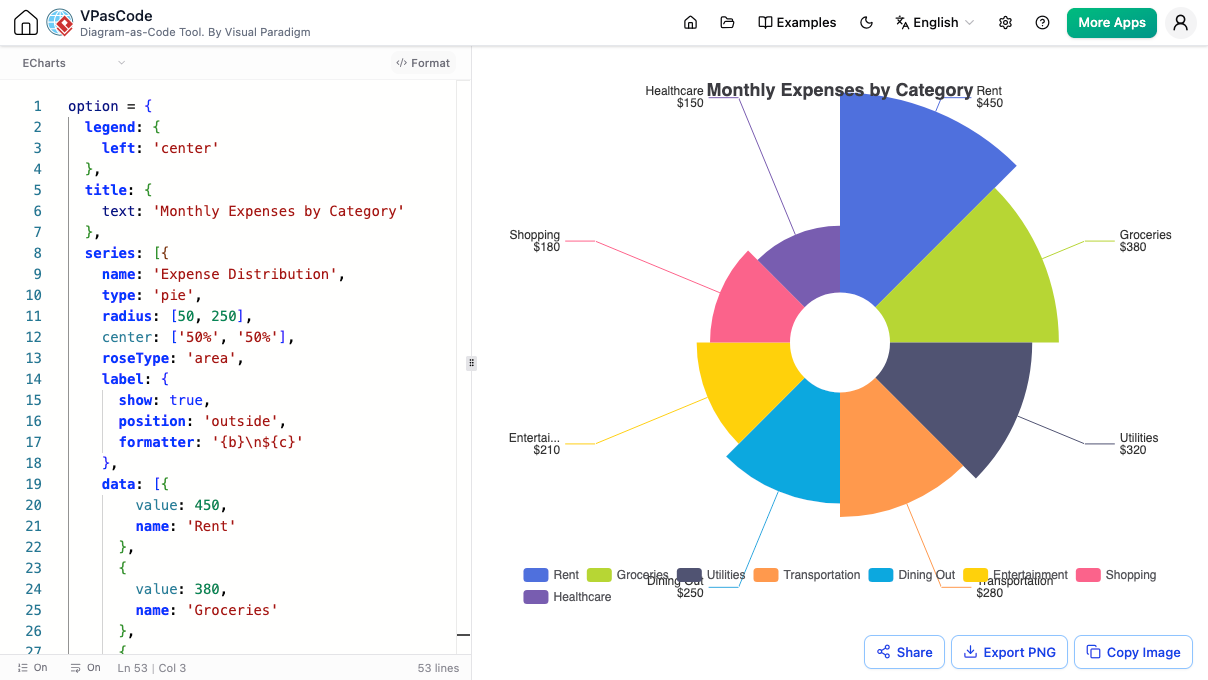
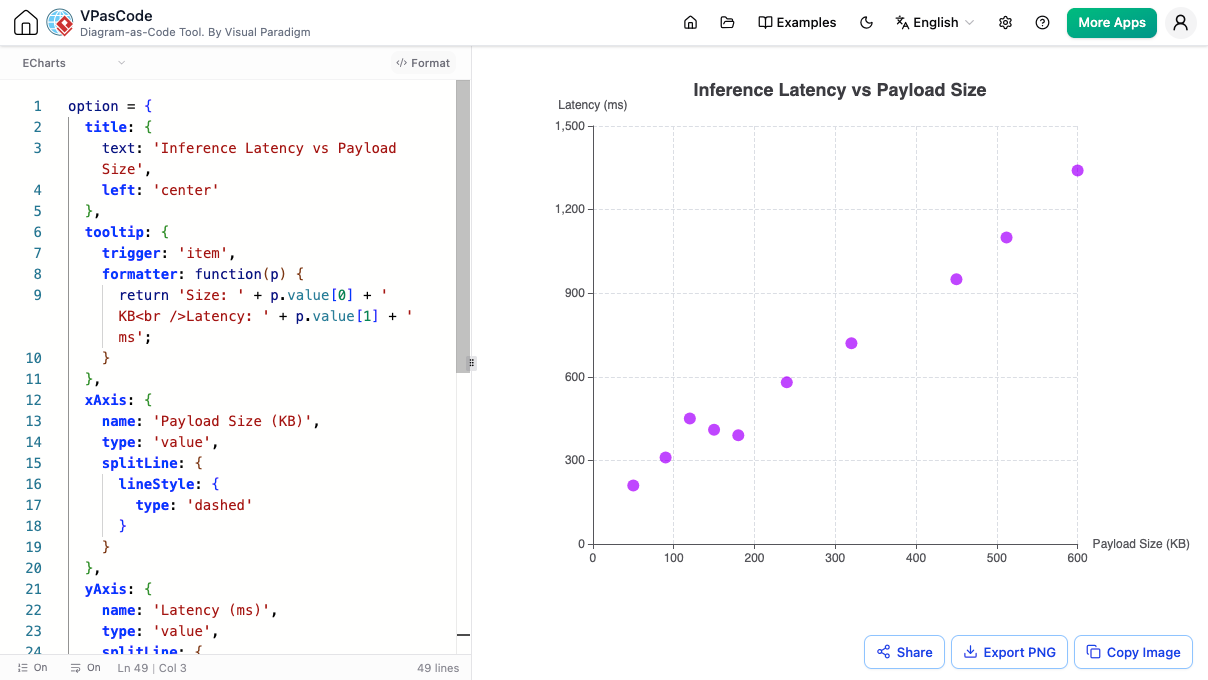
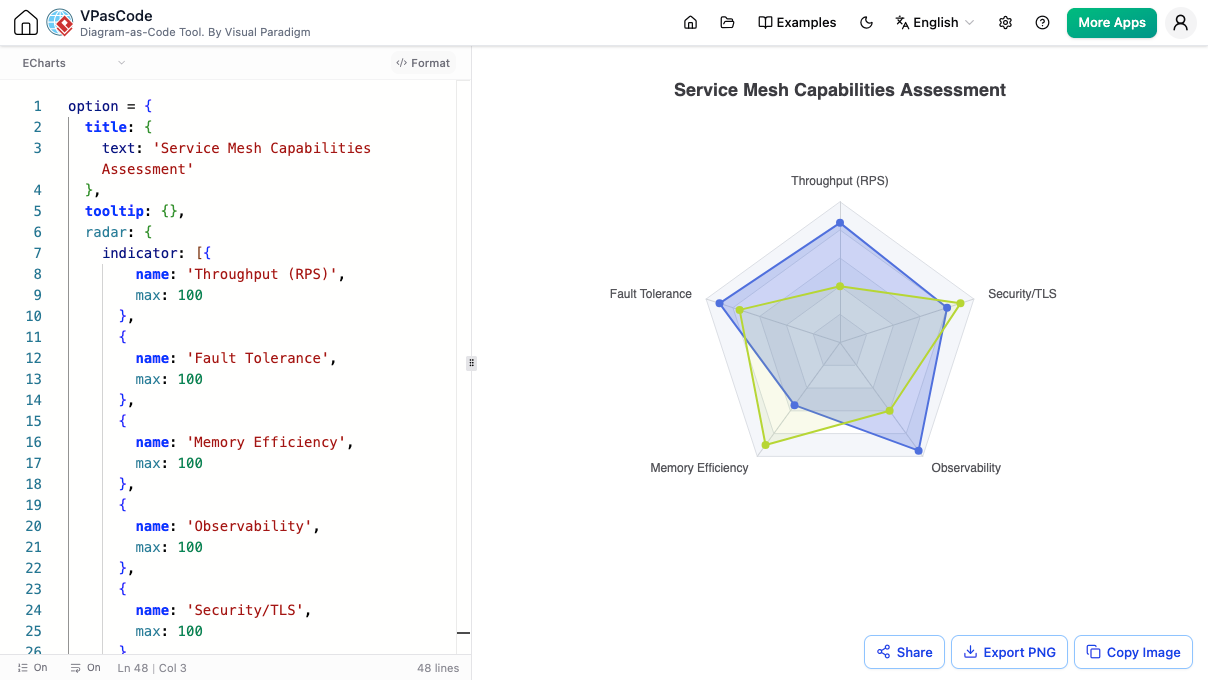
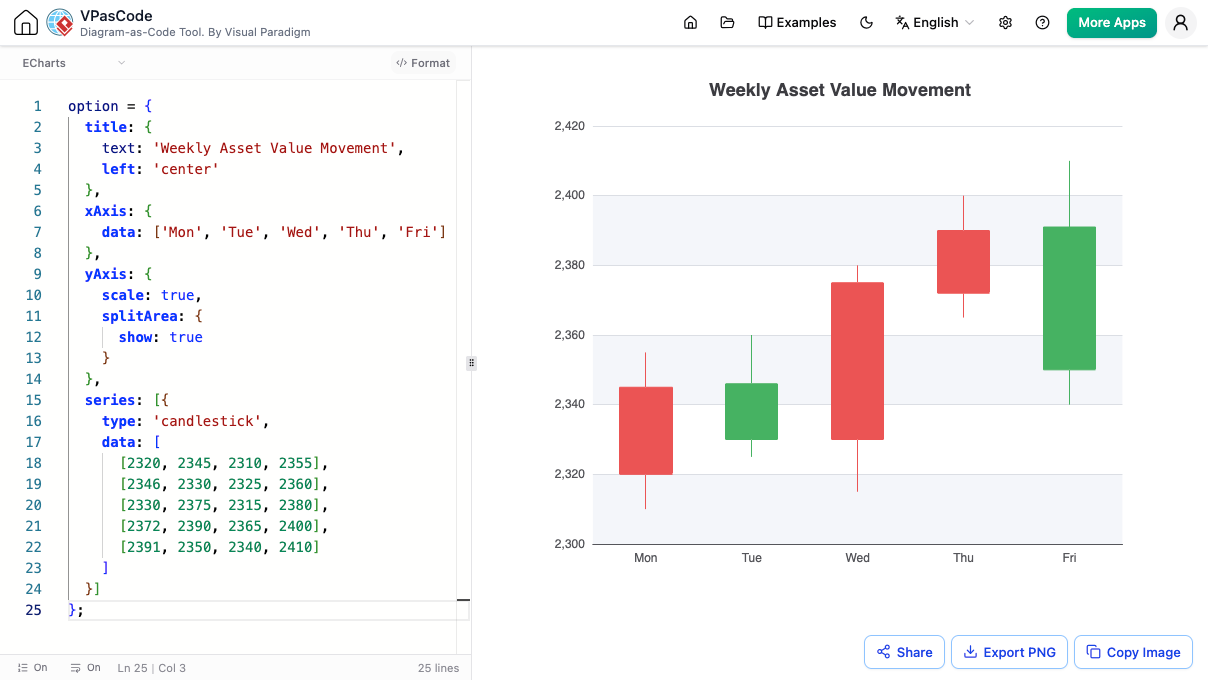
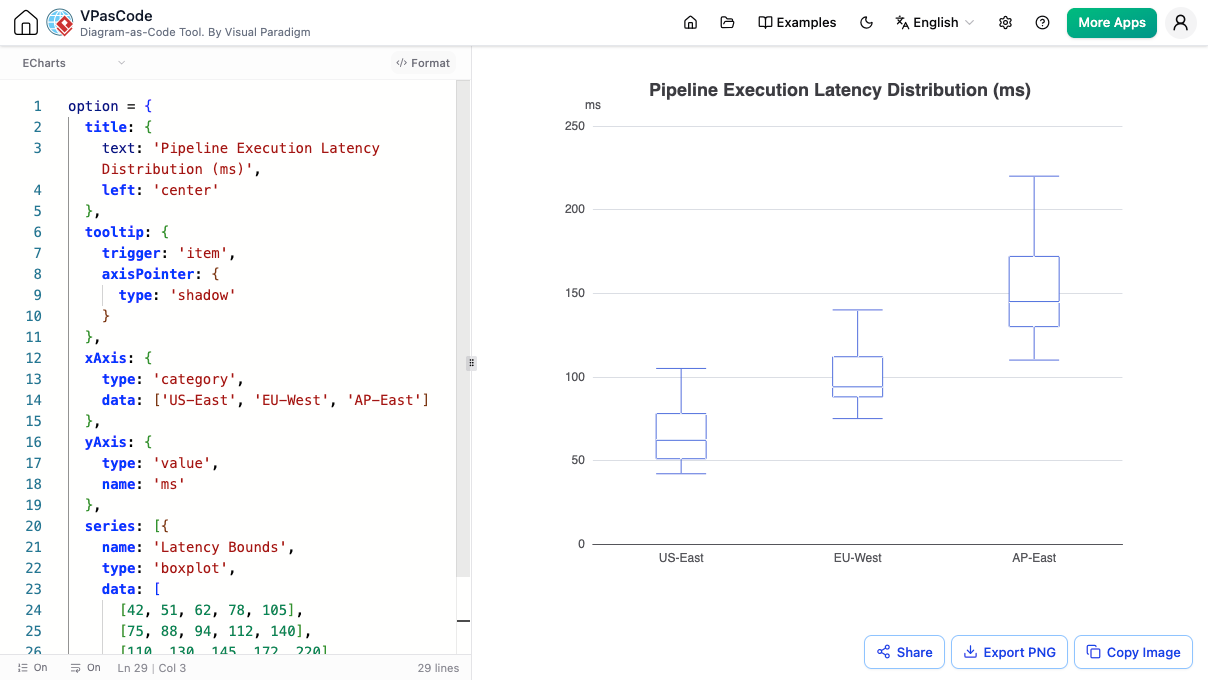
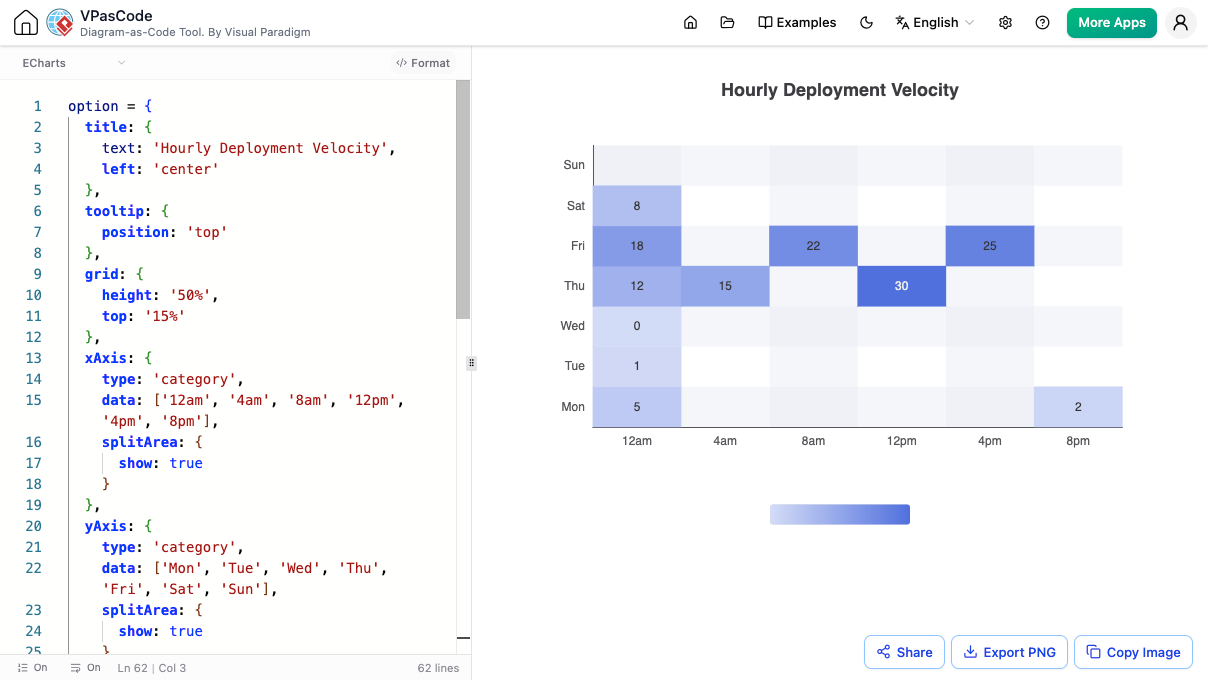
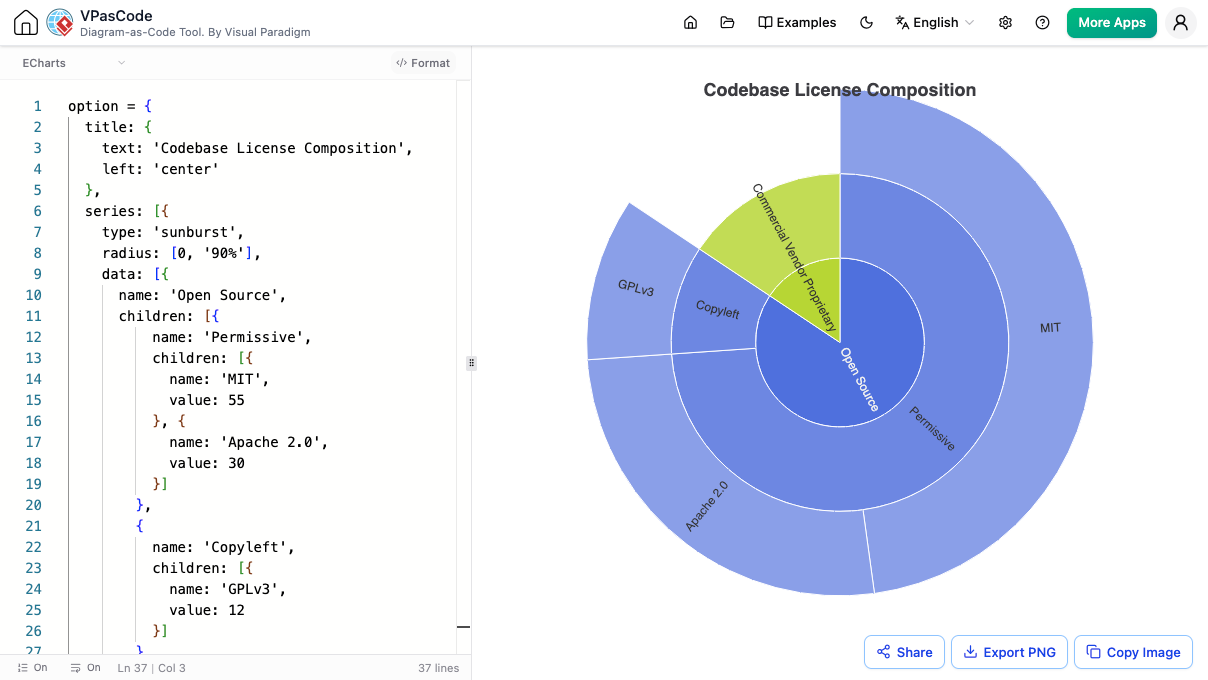
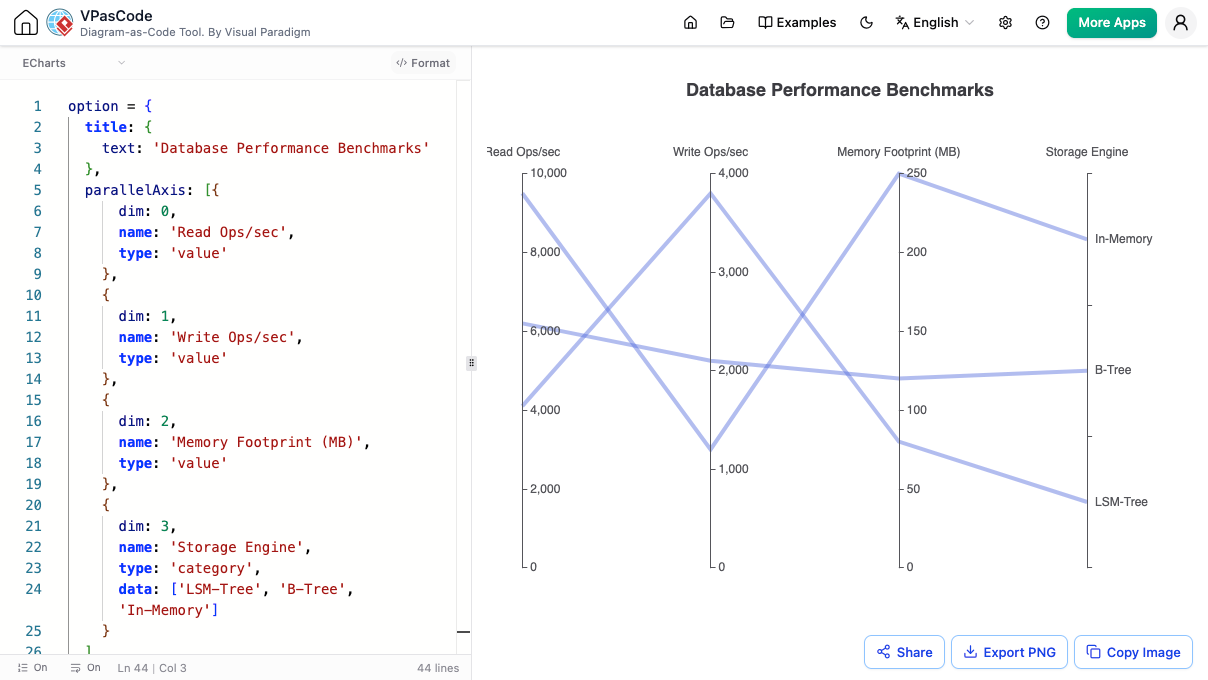
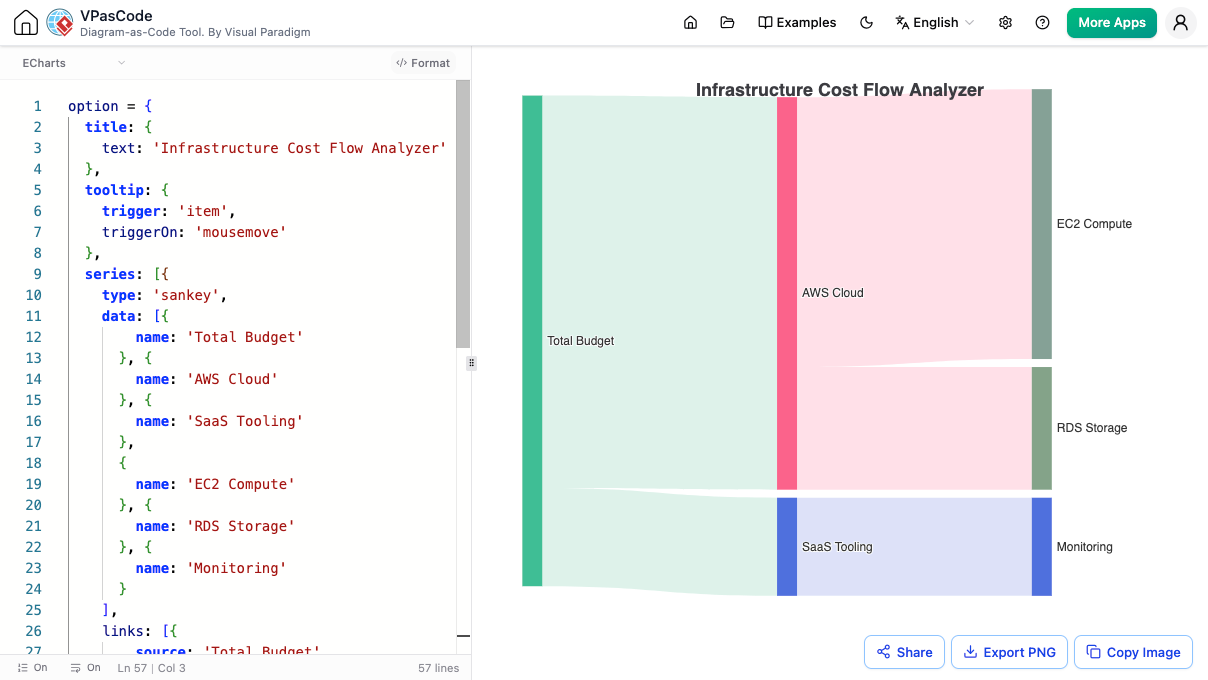
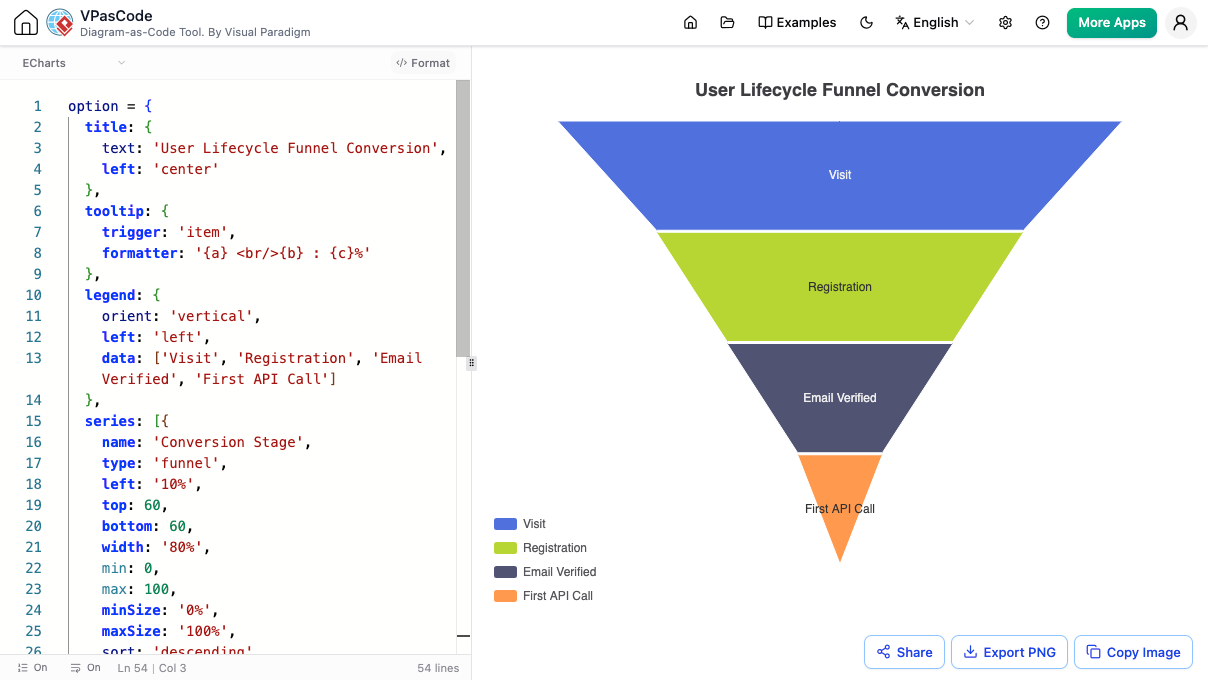
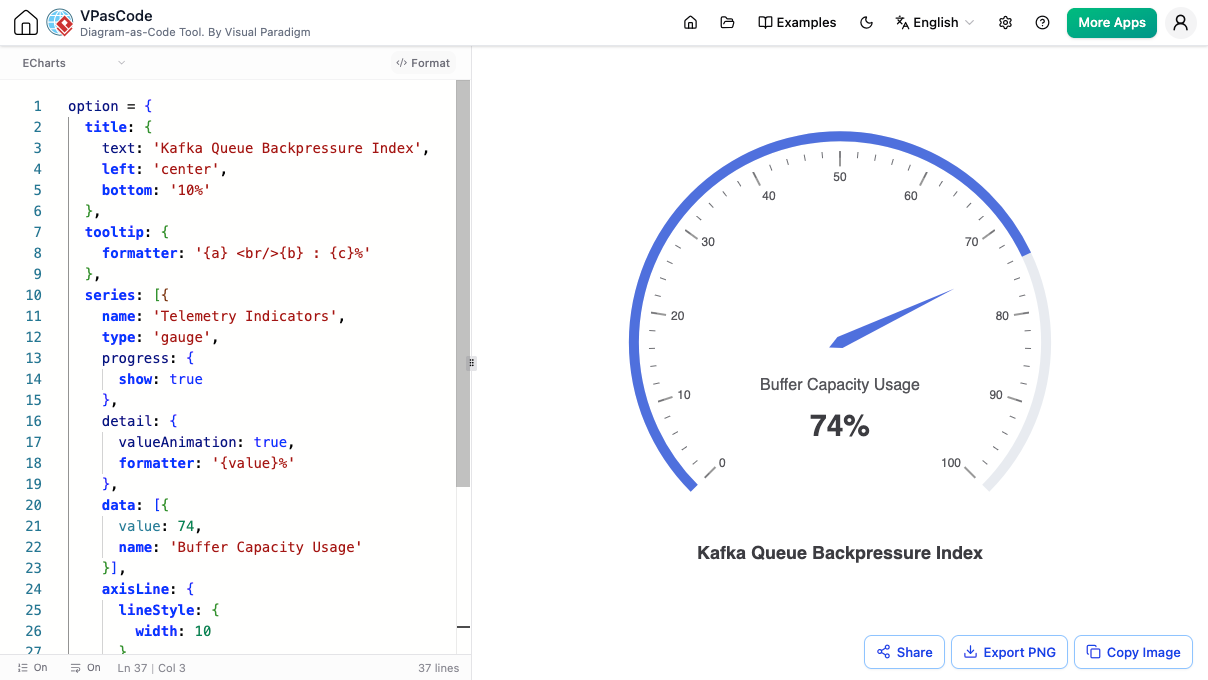
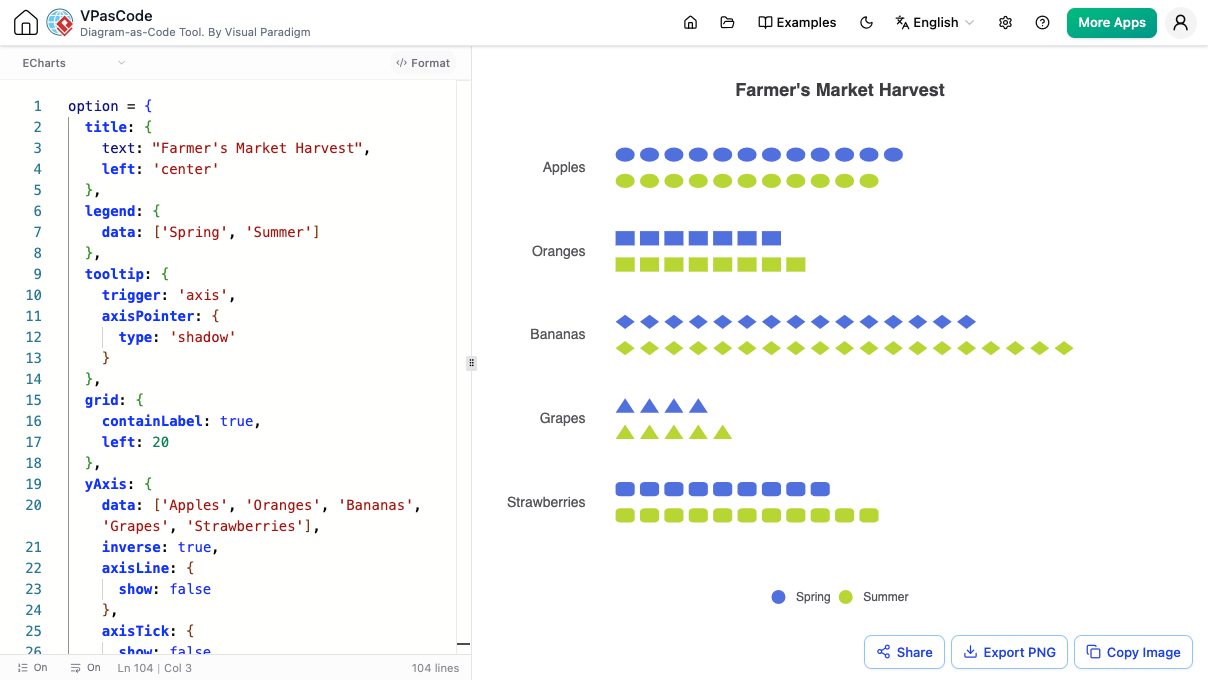
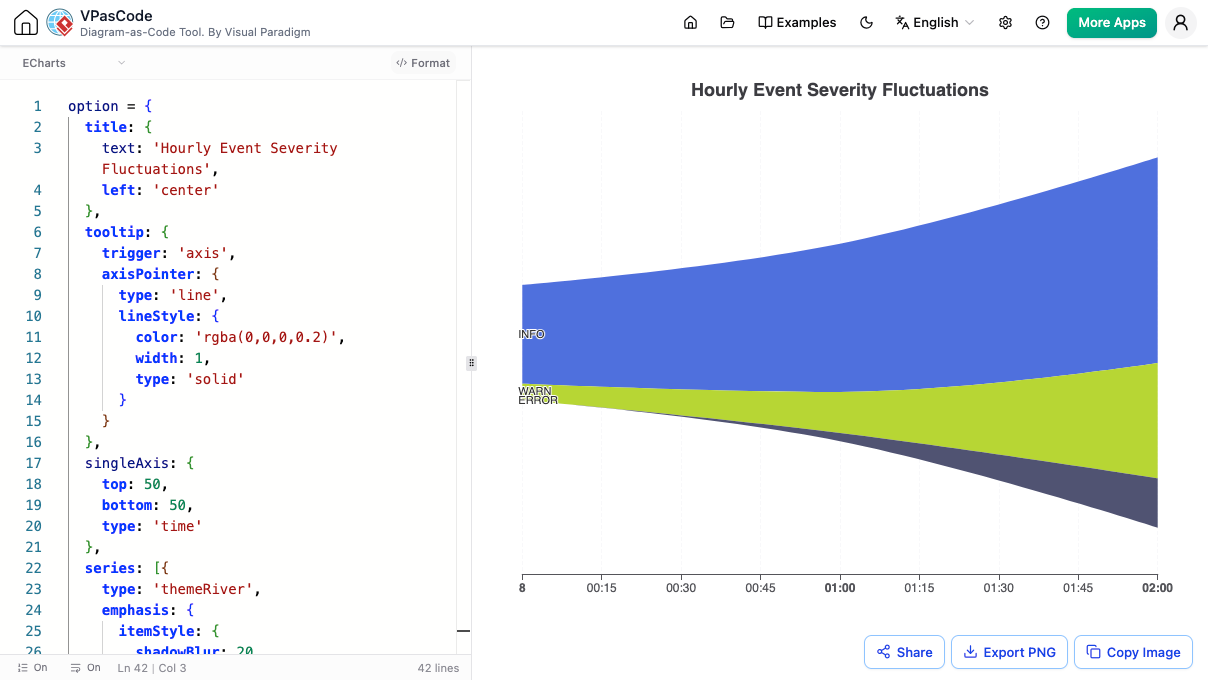
通过自动格式化保持代码井然有序
VPasCode 通过标准缩进实时组织复杂的代码,使其易于阅读且处理速度更快。
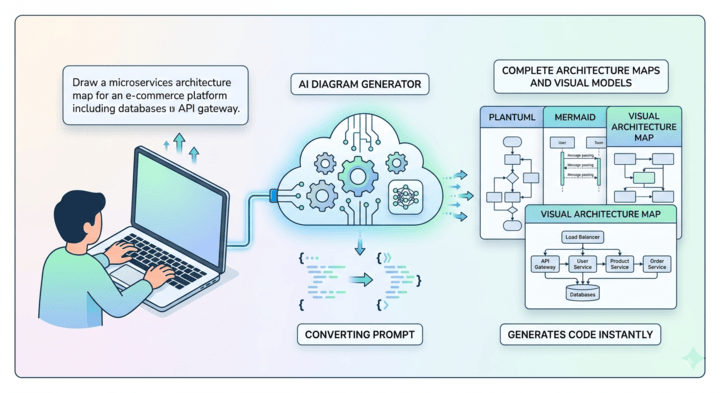
AI ECharts 代码生成器
将原始数据路径转化为完整的可视化配置。快速输入您对图表布局的构想,并让我们的智能 AI ECharts 生成器输出您的起始仪表板蓝图。
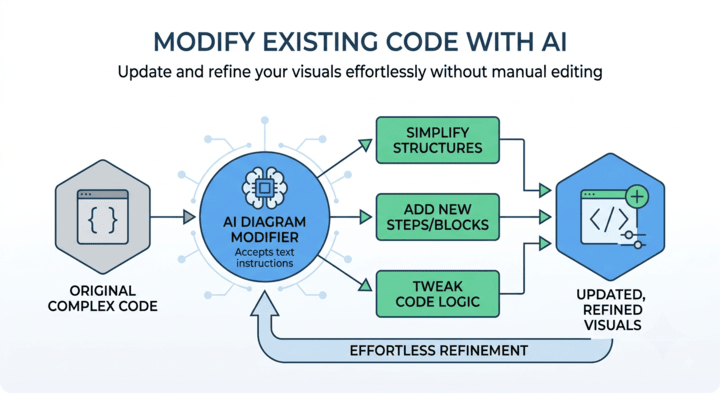
AI ECharts 配置修改
随着需求扩展,无缝演进您的数据视觉效果。指示相容工具安全地注入新的数据数组、变更系列属性或重构您的 ECharts JSON 脚本块。
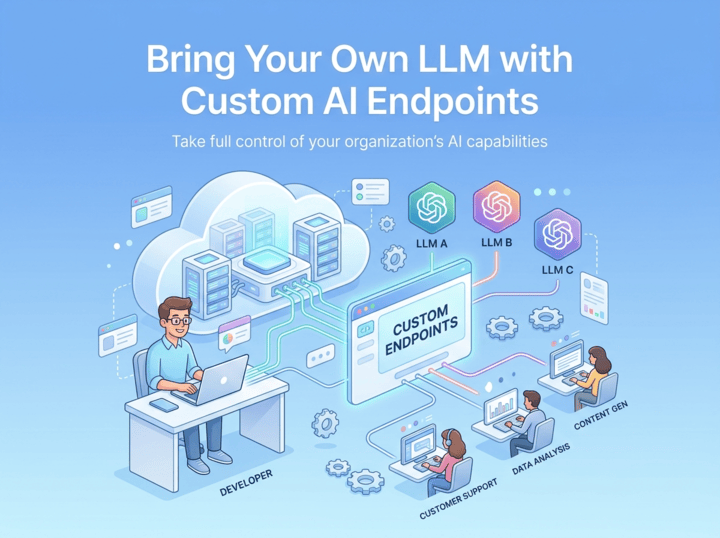
Custom AI Endpoint Compatibility
Route your diagramming requests through your company's approved AI providers using your own API credentials. Stay in complete control of internal data protection policies, security compliance, and AI spending.
Set up custom endpoints in seconds to connect seamlessly with OpenAI, Anthropic, Google, DeepSeek, Mistral, Qwen, Groq, and other supported services.
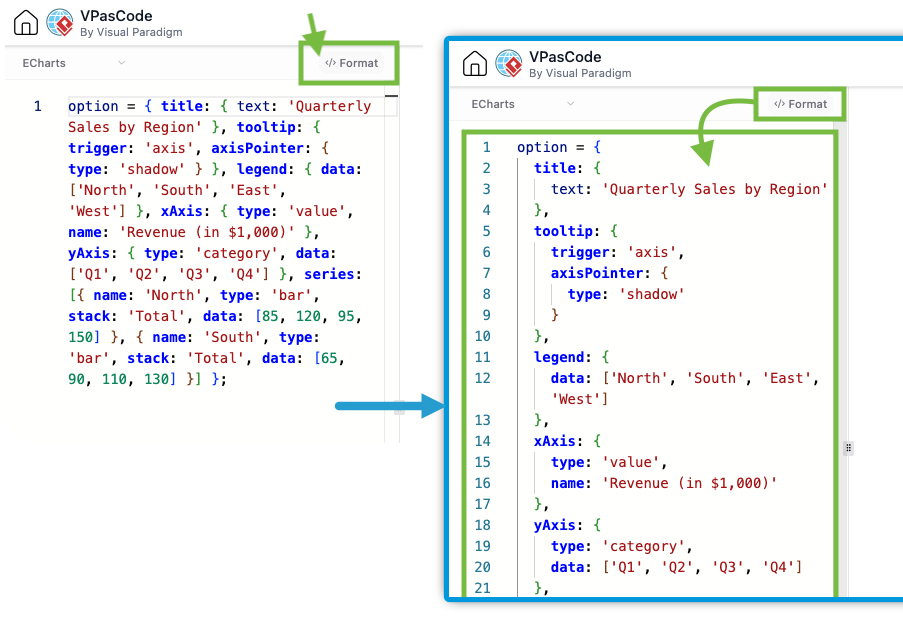
一键 ECharts 代码格式化
处理复杂的 ECharts 代码时,可读性就是一切。将多个属性挤在同一行中,很容易漏掉细节或犯下编辑错误。
使用我们的内置格式化工具,只需点击编辑器顶部的 </> Format 按钮。VPasCode 会立即以干净、标准的缩进组织您的脚本,将属性分散到各自的行中,让您可以轻松寻找并更新图表数据与样式。
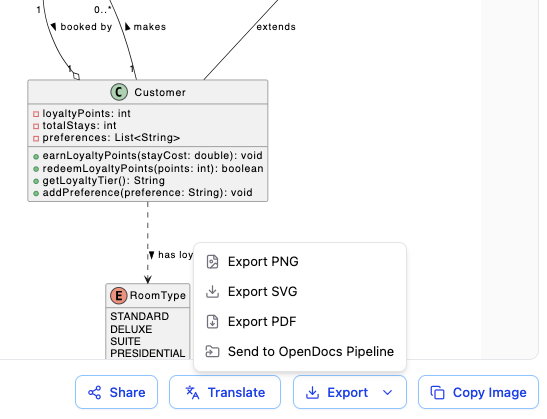
立即转换为 PDF、SVG 或 PNG
获取您所需精确格式的图表。选择适用于正式报告的 PDF、在任何尺寸下都能保持清晰的 SVG,或是用于快速聊天消息的快速 PNG 图片。
功能齐全的 ECharts 工具
立即在线使用
无需担心任何插件或设置。只需打开页面、粘贴您的文本,即可开始设计图表样式。
即时分享
通过直接 URL 或 QR 码分享您的 ECharts 选项与呈现的图表。
实时呈现
我们的在线 ECharts 编辑器会在您配置选项时实时显示图表更新。
自动检测
粘贴任何 ECharts 选项代码。我们的 ECharts 工具会自动识别并呈现图表。
OpenDocs 集成
将您完成的图表发送至 Visual Paradigm OpenDocs 进行文档编制。
同时也是统一工具
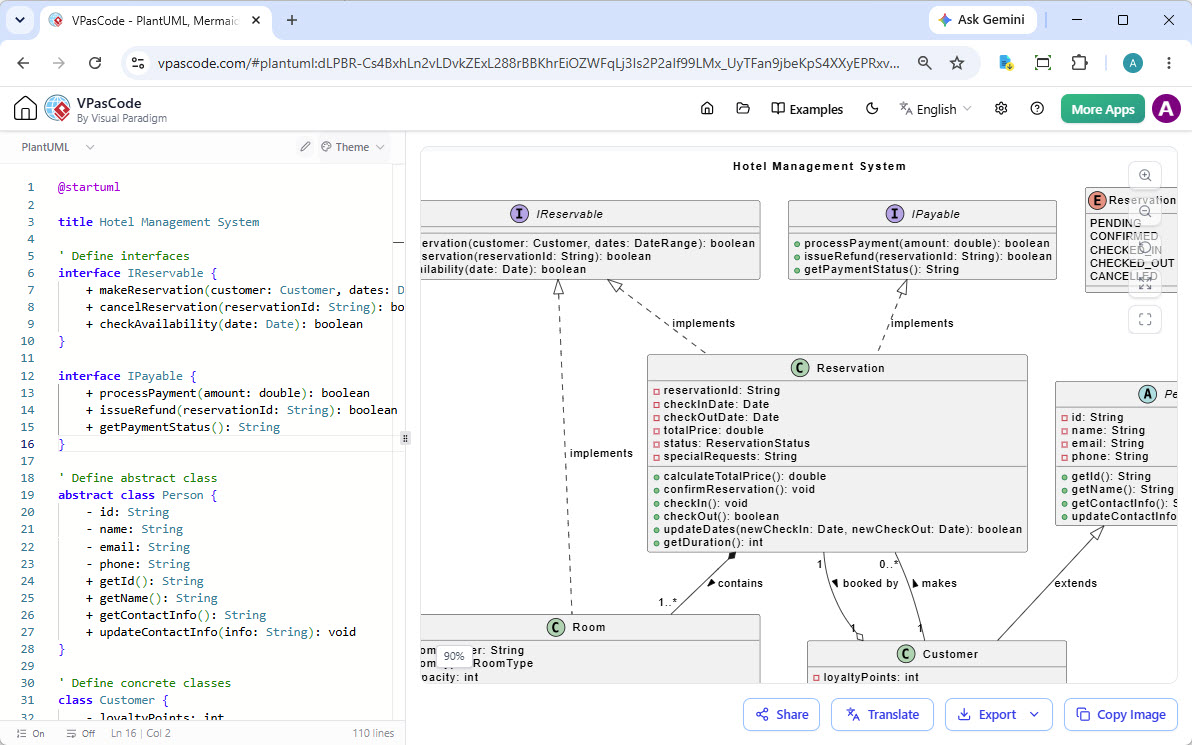
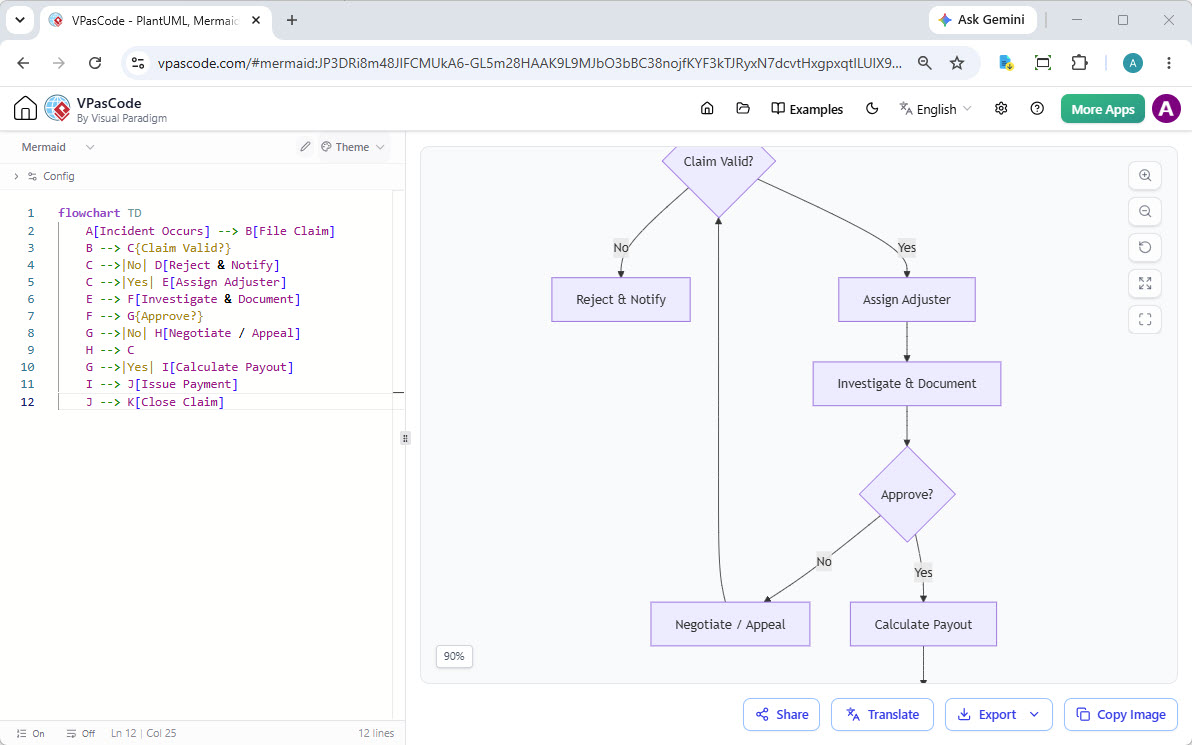
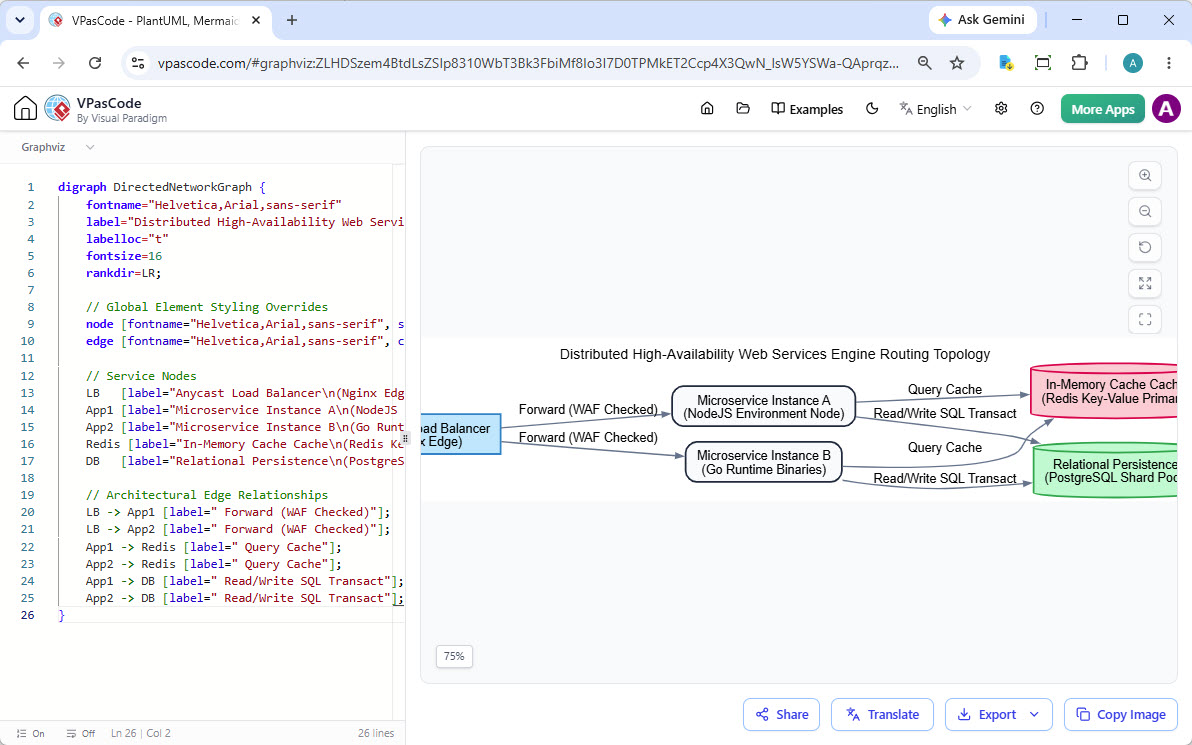
虽然它是顶级的 ECharts 编辑器,但它也支持 PlantUML、Mermaid、Graphviz 等。
适用于所有代码式图表的统一平台
虽然 VPasCode 是一套世界级的 ECharts 工具,但它也是一个统一的图表绘制环境。您学到的技能是可以转移的。轻松使用 PlantUML、Mermaid、Graphviz 创建图表,或将来自 JSON 和 SQL 的数据可视化——全部都在一个地方完成。
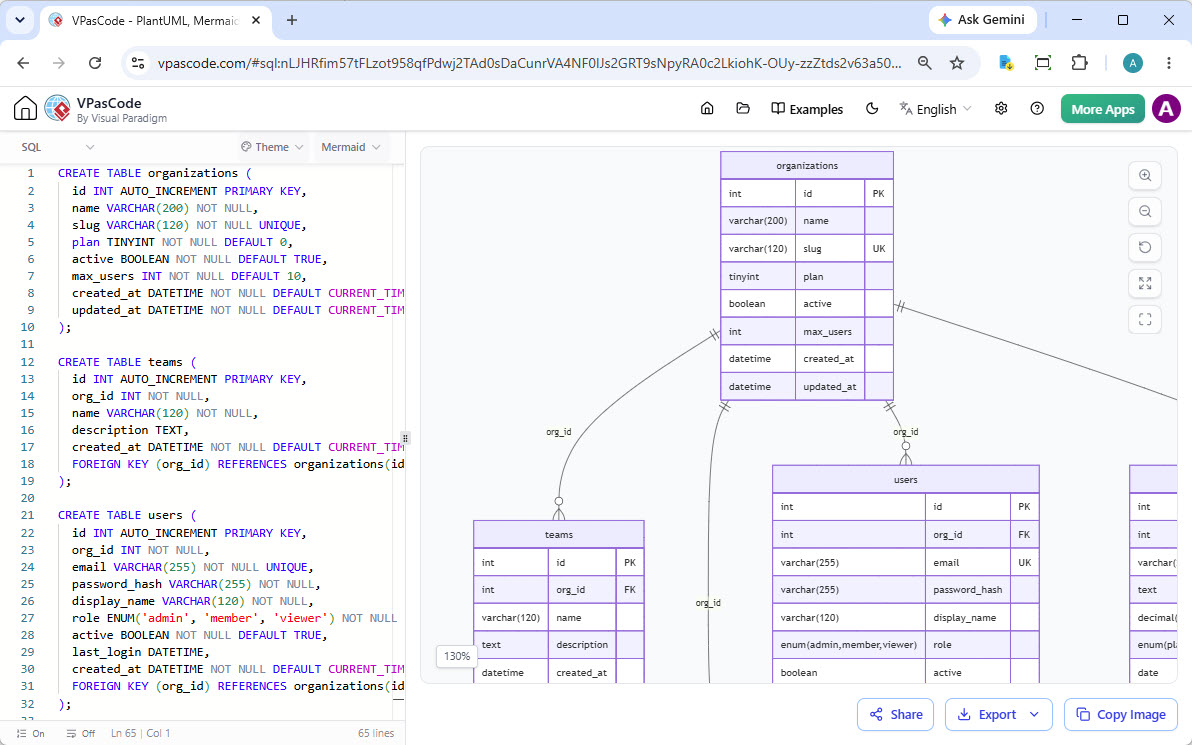
还有更多
将 SQL、JSON、YAML、Markmap 思维导图和其他格式可视化。
与 Visual Paradigm 产品套件无缝集成
您的 ECharts 编辑器是 Visual Paradigm 生态系统的关键组件,确保从最初概念到最终文档的顺畅工作流程。
使用 AI 生成,用 VPasCode 臻于完美
使用 Visual Paradigm AI 绘图聊天机器人从自然语言提示生成复杂的 ECharts 选项。然后,在您的 ECharts 编辑器中打开生成的代码,以微调每一个细节。
立即试用 AI 绘图聊天机器人
将图表绘制连接至文档编制
图表通常是较大故事的一部分。只需单击,即可将完成的工作从您的 ECharts 工具直接发送至 Visual Paradigm OpenDocs,以建立丰富、可分享的知识库与项目文档。
受到全球领先团队的信赖
我们的 ECharts 编辑器和更广泛的建模平台被全球最成功公司的专业人士所使用。







准备好提升您的数据可视化水平了吗?
停止与静态图表苦苦挣扎。立即使用网上最棒的免费 ECharts 编辑器,开始建立动态、交互式的数据可视化。无需复杂的设置。
您的 ECharts 编辑器问题解答
什么是 ECharts 编辑器?
ECharts 编辑器是用于编写 ECharts 选项(通常为 JSON 格式)以定义交互式数据可视化的专用工具。VPasCode ECharts 编辑器能在您配置图表的同时提供实时预览,大幅简化设计流程。
这是一个免费的 ECharts 编辑器吗?
是的,我们的核心 ECharts 编辑器功能完全免费。您可以免费设计、编辑、实时预览并将图表导出为 SVG/PNG。
Visual Paradigm VPasCode 支持 AI 图表生成吗?
支持!VPasCode 在编辑器内部直接提供内置的原生 AI 图表生成功能。
只需输入自然语言提示(例如“在 ECharts 中生成每月销售柱状图”或“创建显示市占率分布的饼图”),VPasCode 就会立即编写 ECharts JSON 配置并原生呈现图表。
我可以在 VPasCode 内部编辑使用 Visual Paradigm AI 绘图聊天机器人生成的图表吗?
可以!您可以使用独立的 Visual Paradigm AI 绘图聊天机器人生成初始图表概念,然后点击“在 VPasCode 中打开”将生成的 ECharts 配置推送到编辑器中。从那里,您可以随需自由更新底层数据集、调整坐标轴参数、变更色彩配置或微调交互选项。
使用 ECharts 可以创建哪些类型的图表?
ECharts 功能极其多元,支持各种图表类型,包括折线图、柱状图、饼图、散点图、矩形树图、热力图以及各种统计图表。我们的 ECharts 工具充分利用了这项完整功能,让您能将几乎任何数据集可视化。
ECharts 与其他图表库相比如何?
ECharts 以丰富的互动功能、强大的呈现能力和详尽的文档脱颖而出,非常适合用于复杂且企业级的数据可视化。虽然存在其他库,但我们的 ECharts 编辑器能让您轻松发挥其最大潜力,打造出惊艳且高性能的图表。