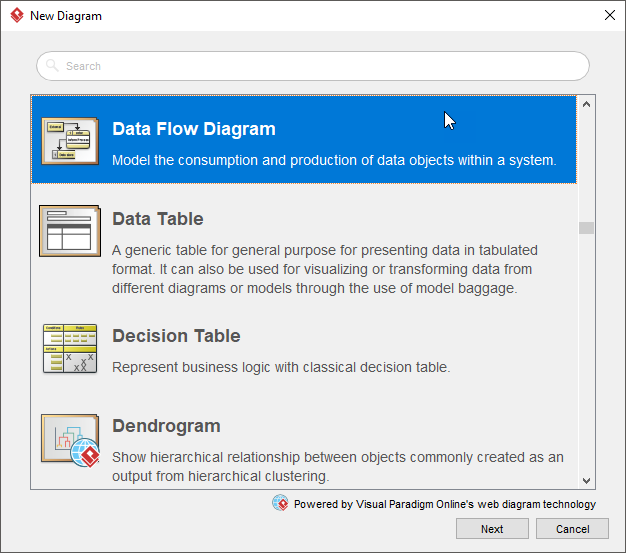
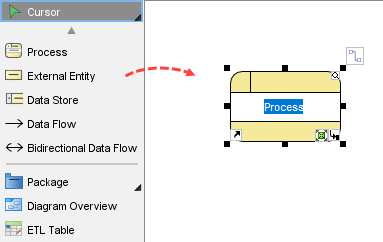
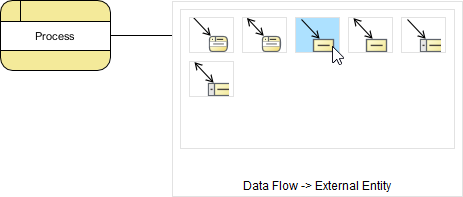
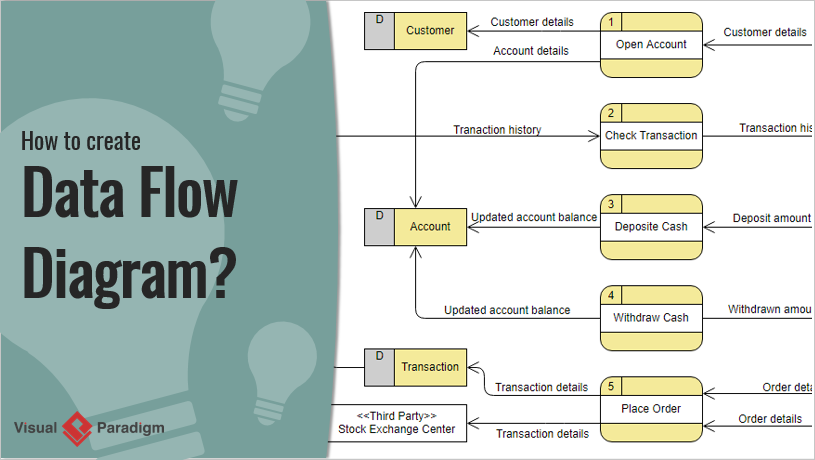
Want to create a Data Flow Diagram (DFD)? We will provide you with an introduction to DFD and let you know how you can create DFD with our DFD software.
Data flow diagram (DFD) is a diagram being used frequently in software design. It visually represents the flow of data throughout processes in a given system. DFD shows the kind of information that will be input to and output from processes as well as where the data will be stored.
A typical information system involves processing a lot of information and processes. The purpose of Data Flow Diagrams is to view systems as a whole with its scopes and boundaries while it illustrates the movement of information between components. The focus of DFD is on the flow of data throughout the system, not process flow. DFD allows readers to easily see how the system will operate by knowing the kind and flow of information involved.
There are two main types of DFD: Physical and Logical.
Physical DFD: Focuses on the physical aspect of the system by showing “how” the system will be implemented
Logical DFD: Focuses on a higher-level view of the system and “what” it will achieve.
Unlike other diagrams, DFD can be drawn at different levels, based on the purpose they are drawn to serve.
Context DFD is sometimes referred to as level 0 DFD. It’s the top-level diagram among all, which illustrates the entire system in its relationship to any external entities.
Level 1 DFD is the level under the context-DFD. It illustrates the main functions within the system. Level 1 breakdown the context level by including more details. It represents how the data enters and exits the system, where it is stored and how the basic processes convert it from one form to another.
Level 2 DFD (or further) goes into deeper detail. It shows how the data flows within the main process of the system.
You should create as many levels of DFD as you need until the desired level of detail is met.