使用我們的 免費 Graphviz 編輯器 視覺化複雜網路
使用我們頂級的 Graphviz 工具,讓您的資料結構與網路圖表活靈活現。VPasCode 是一個智慧型的 線上 Graphviz 編輯器,可即時算繪 DOT 語言,助您輕鬆建立並理解複雜圖形。
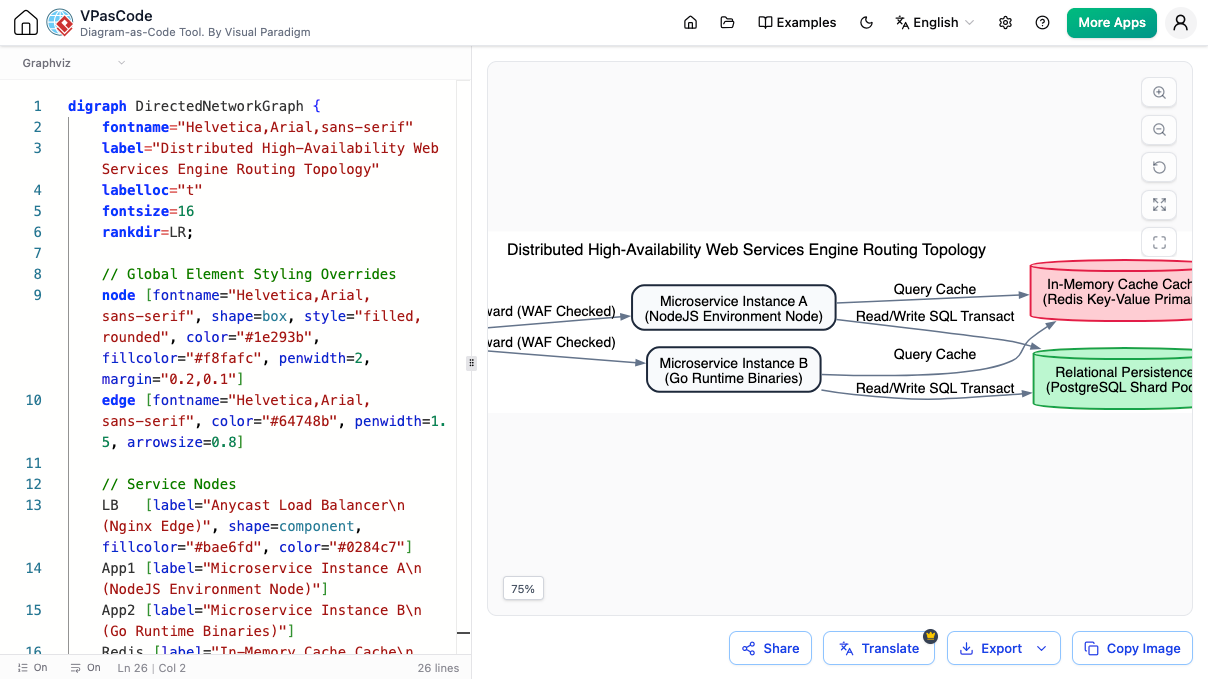
厭倦了盲目編寫 DOT 語言嗎?
在沒有即時視覺回饋的情況下編寫 DOT 語法既緩慢又容易出錯。您需要一個專用的 Graphviz 編輯器,在您輸入時向您顯示結果並協助您掌握語法,而不是單純的純文字編輯器和獨立的命令列工具。
即時 Graphviz 遊樂場
我們的 Graphviz 工具 專為探索與速度而打造。編寫 DOT 語言,即可立即看到您的有向圖與無向圖出現。沒有比這更好的方法來學習、建立和偵錯您的 Graphviz 作品了。
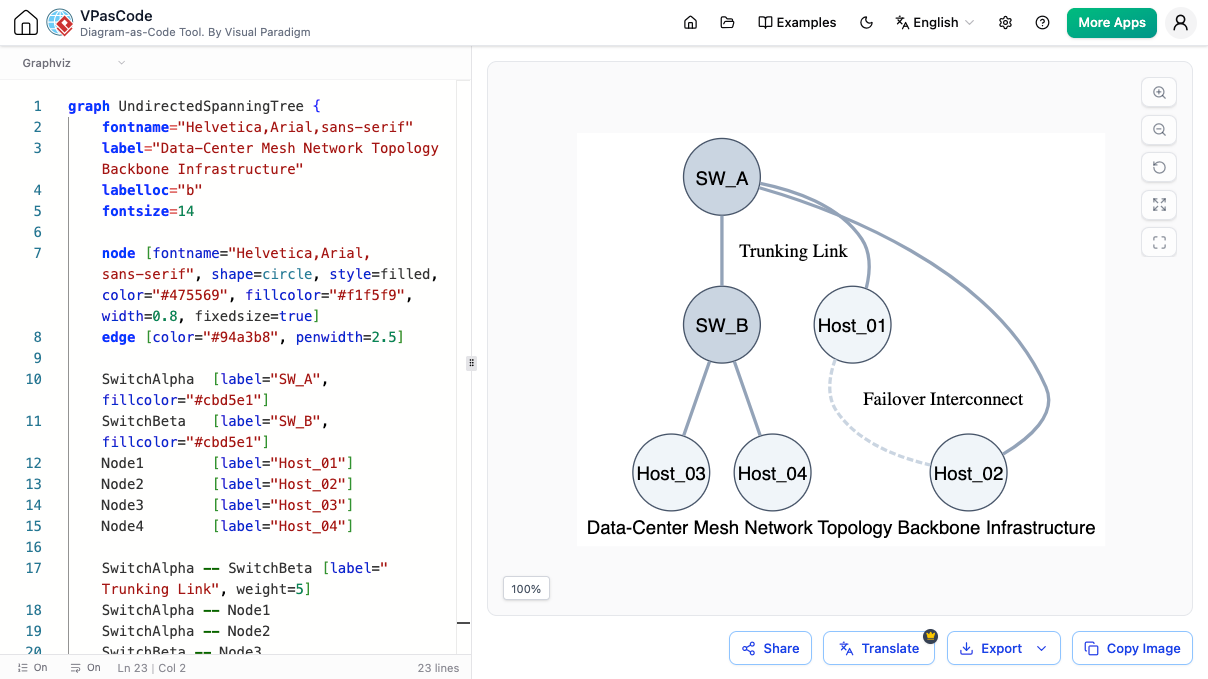
從 Graphviz 編輯器中的 DOT 語言算繪的有向圖。
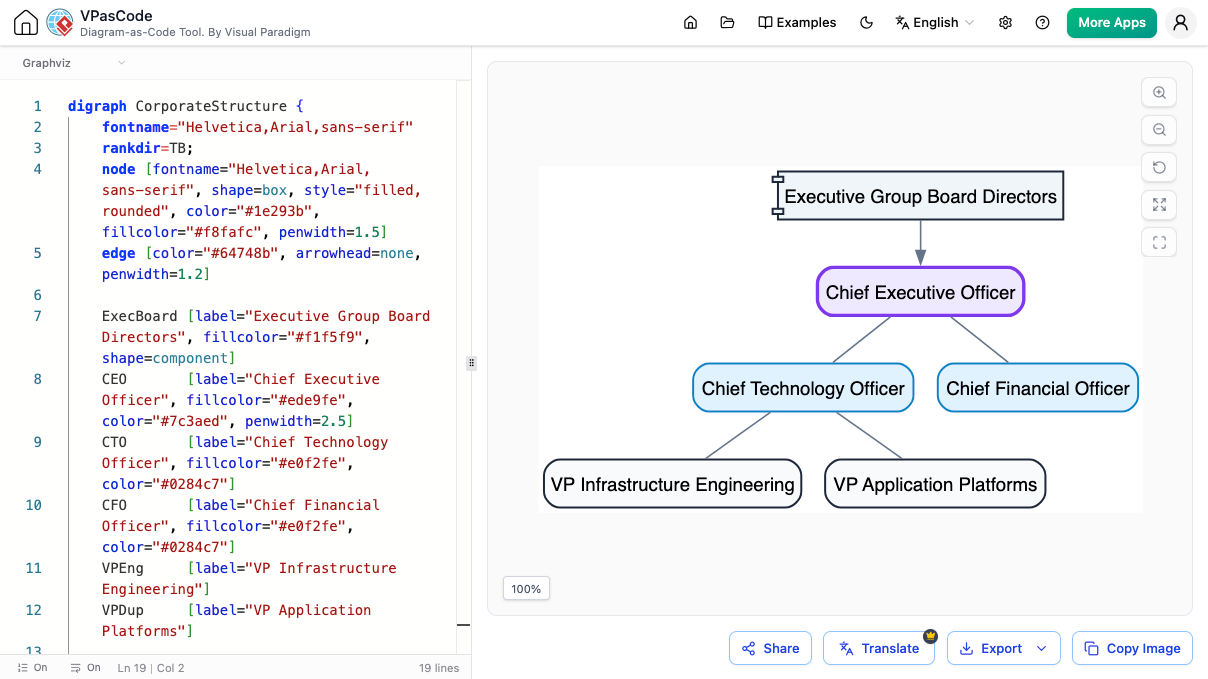
具備 AI 增強功能的 Graphviz 工具
VPasCode 將 AI 直接整合到 Graphviz 編輯器 中,加速您的工作流程。
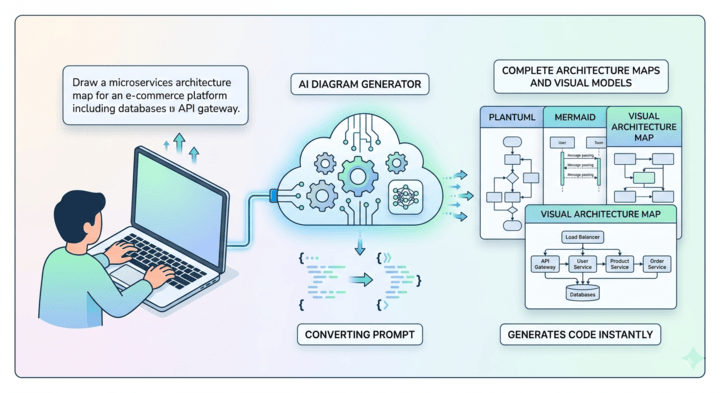
AI Graphviz DOT 產生器
立即啟動您下一個複雜的網路圖表。只需輸入您的概念,看著系統在您眼前建構出完全有效的 Graphviz DOT 語法。
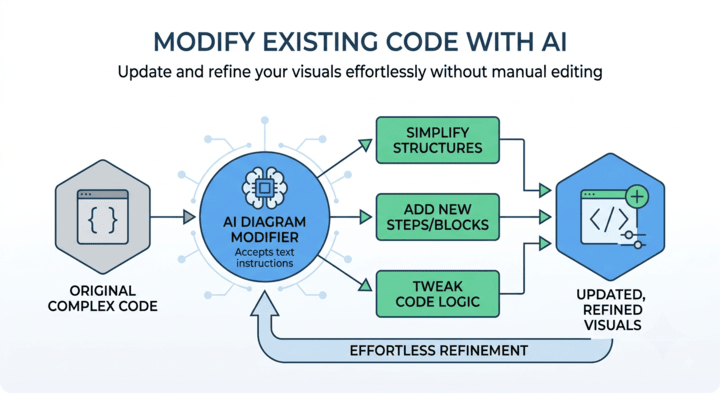
AI Graphviz 配置修改
重構複雜的資料圖表無需重寫指令碼。使用智慧配置指令輕鬆對調節點、反轉相依性,或簡化複雜巢狀的 Graphviz 指令碼程式碼。
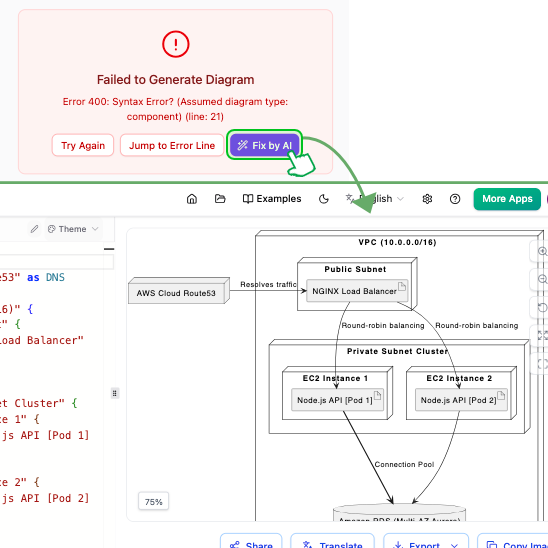
使用 AI 修正 DOT 語言錯誤
DOT 檔案中的語法錯誤可能很難發現。我們的 Graphviz 編輯器 提供一鍵式 AI 程式碼錯誤修正 功能,可立即解決問題並讓您的圖表正確算繪。
AI 也會解釋修正方式,協助您了解 DOT 語言的細微差別。這是掌握圖表視覺化最智慧的 免費 Graphviz 編輯器。
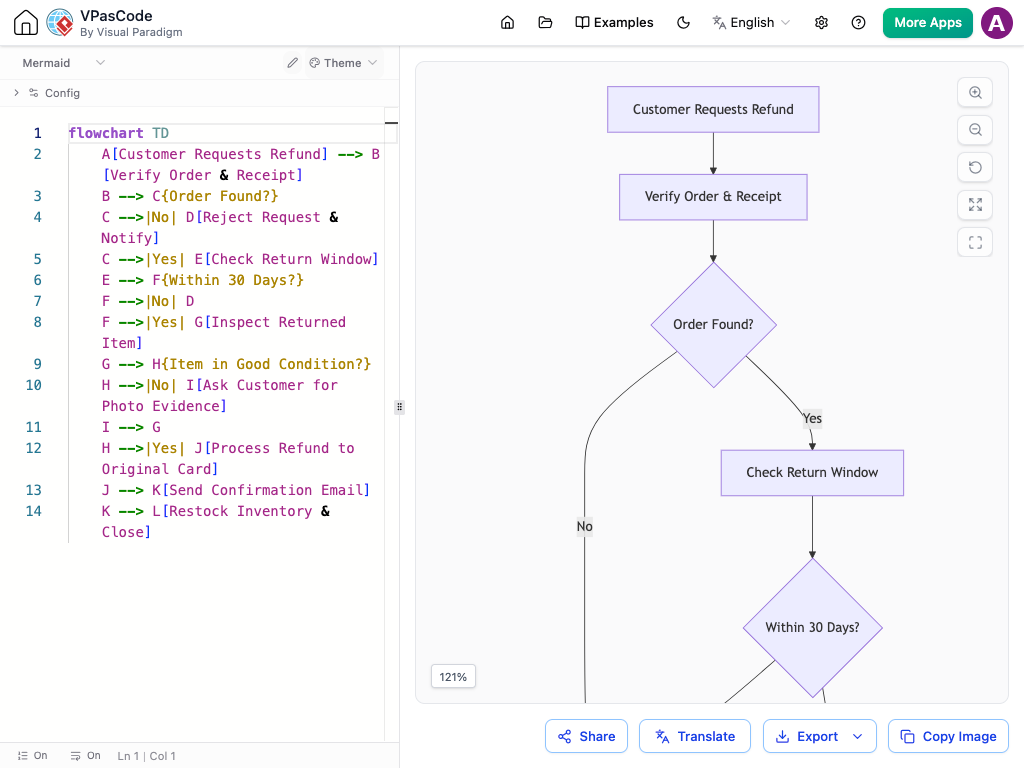
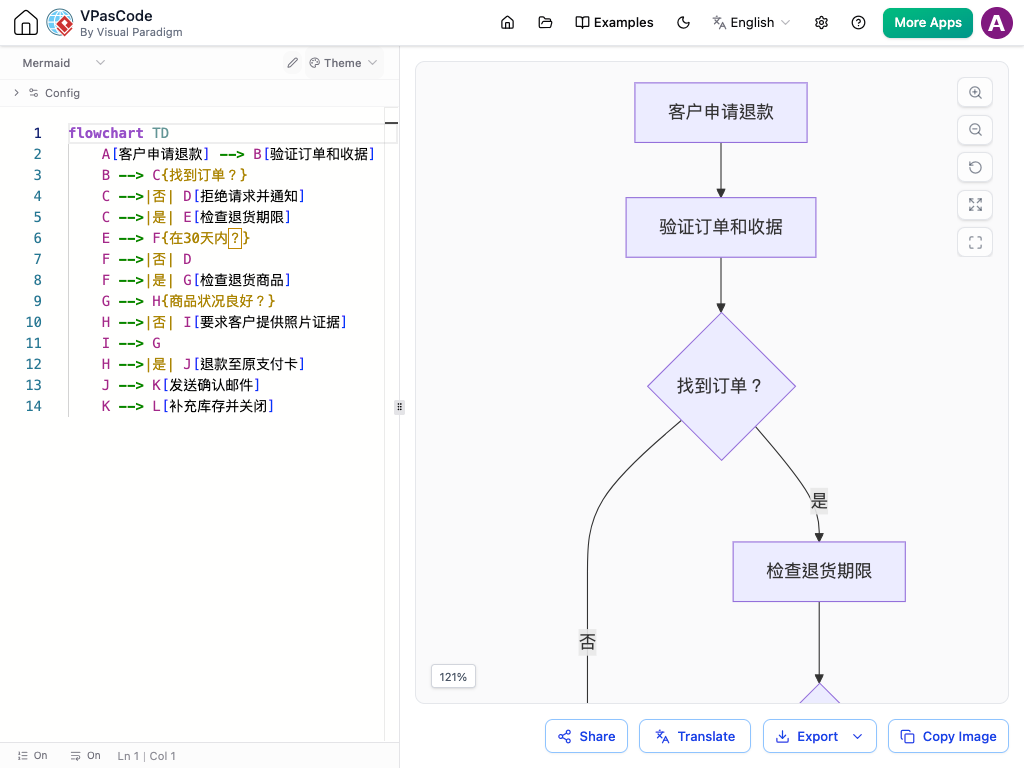
使用 AI 翻譯圖表標籤
需要與國際受眾分享您的圖表?使用我們 Graphviz 編輯器 中的 AI 圖表翻譯 功能,即可立即將所有文字標籤轉換為其他語言,使您的視覺化內容達到全球通用的效果。
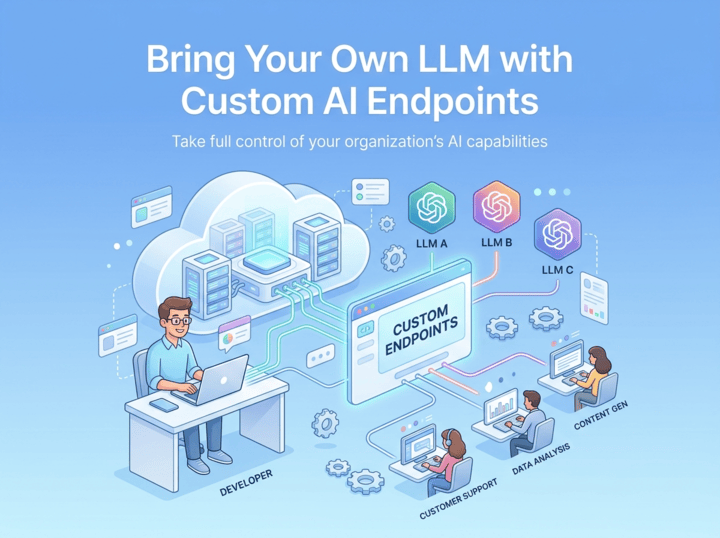
Custom AI Endpoint Integration
Direct your AI operations through your preferred providers using your own corporate API keys. This gives your team full authority over privacy governance, security standards, and API budget limits.
Easily configure custom endpoints to connect with major models from OpenAI, Anthropic, Google, DeepSeek, Mistral, Qwen, Groq, and more.
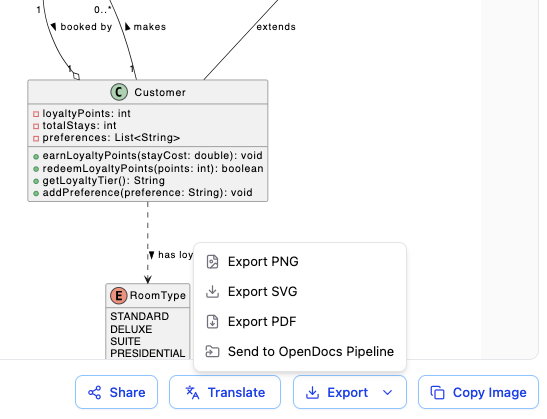
匯出為向量 PDF、SVG 或 PNG
輕鬆將您的 PlantUML 程式碼轉換為生產就緒的檔案。將您的圖表下載為適用於正式報告與列印的高品質 PDF、適用於技術文件的可縮放 SVG,或是用於團隊快速聊天的清晰 PNG。
功能齊全的 Graphviz 工具
完全在您的瀏覽器中執行
無需安裝,因為此工具直接在網路上執行。只需貼上您的圖表程式碼即可檢視與變更。
即時分享
透過直接 URL 或 QR 碼分享您的 DOT 程式碼與算繪圖形。
即時 DOT 算繪
我們的 線上 Graphviz 編輯器 會在您輸入時即時顯示圖表更新。
自動偵測
貼上任何程式碼。我們的 Graphviz 工具 會識別 DOT 語言並進行算繪。
OpenDocs 整合
將您完成的圖表傳送至 Visual Paradigm OpenDocs 進行文件編製。
同時也是統一工具
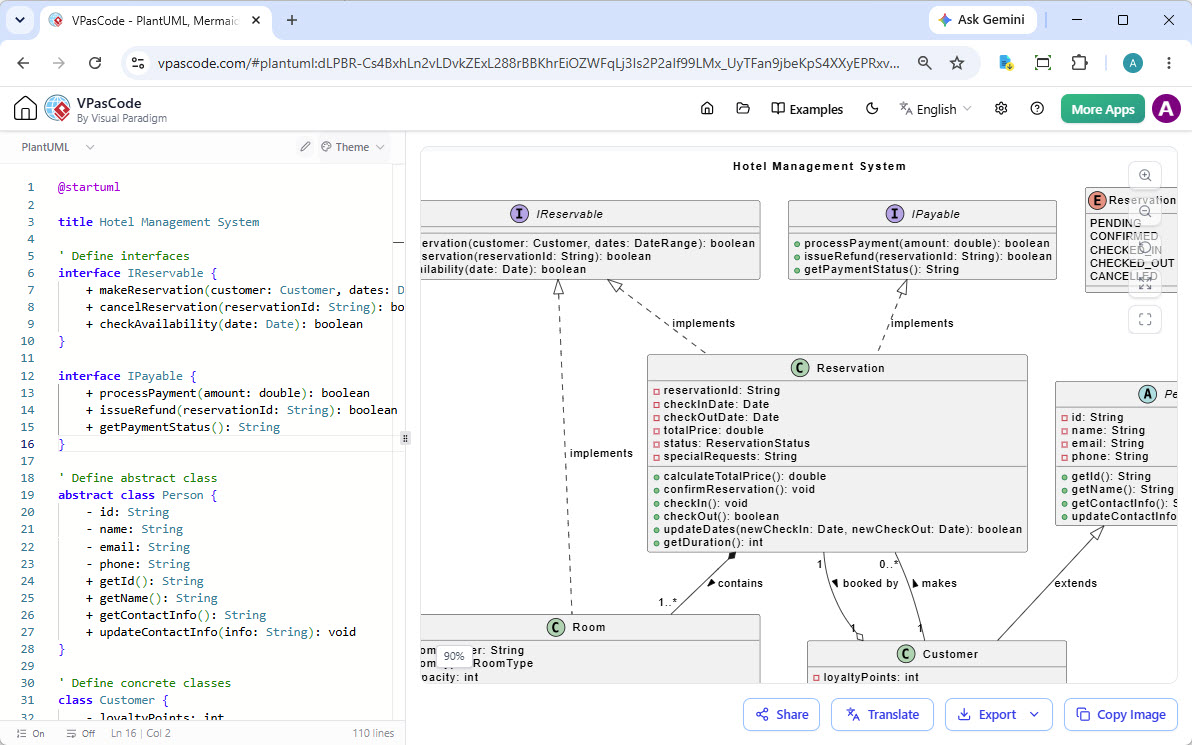
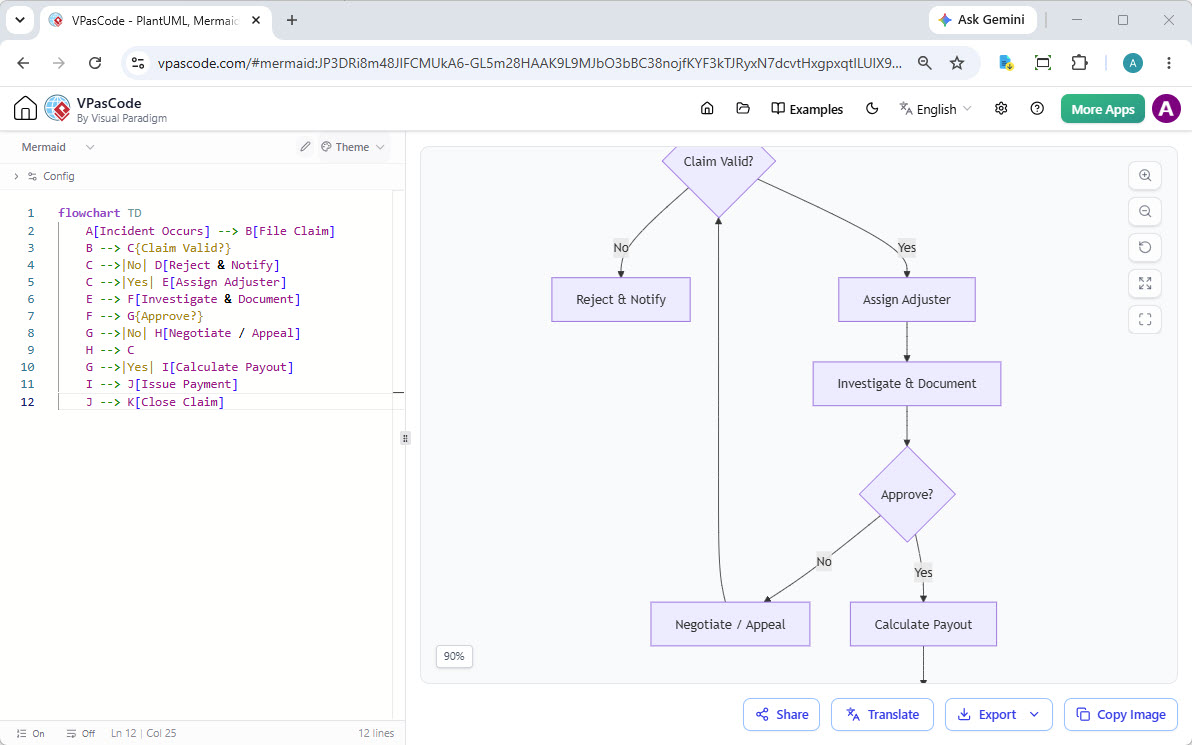
雖然它是一流的 Graphviz 編輯器,但它也支援 PlantUML、Mermaid 等功能。
適用於所有程式碼式圖表的統一平台
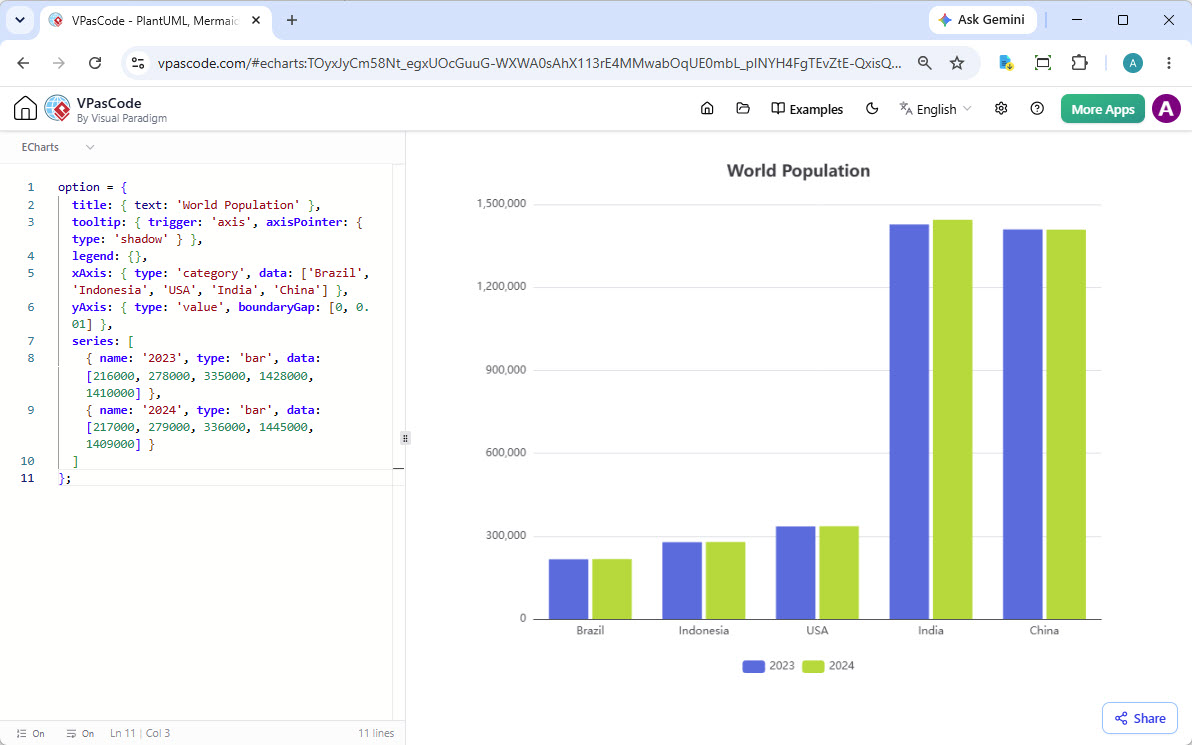
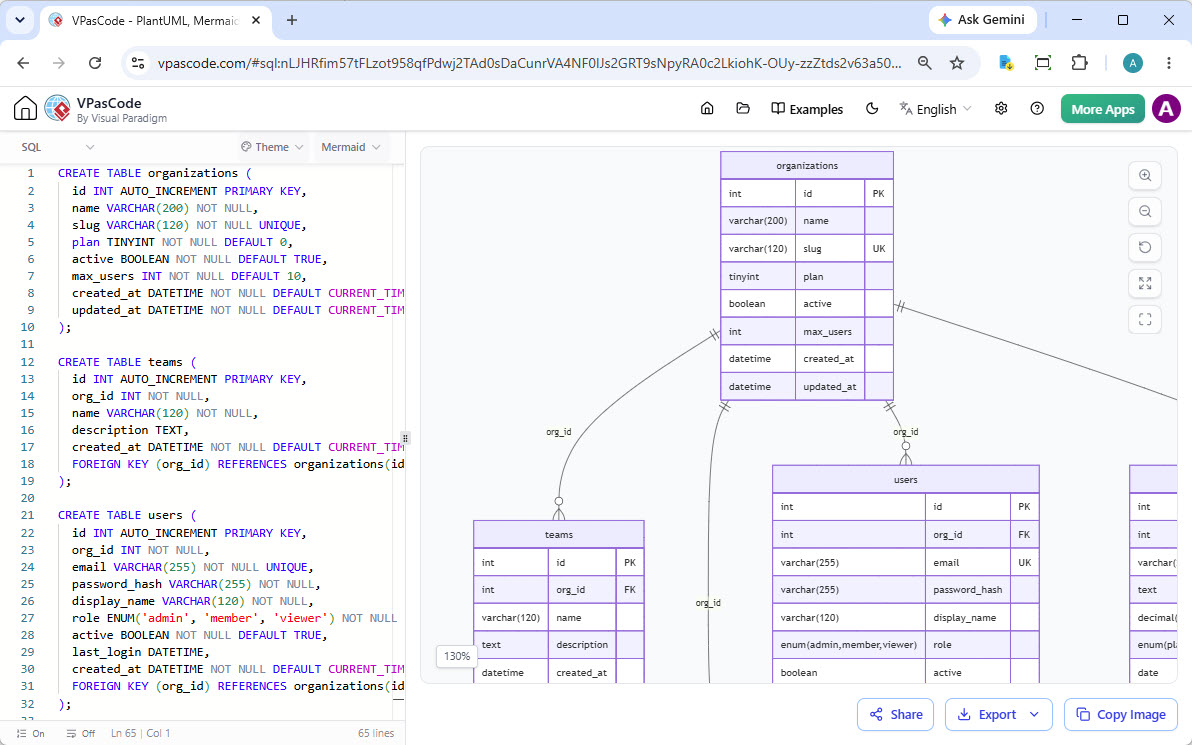
雖然 VPasCode 是一個世界級的 Graphviz 工具,但它也是一個統一的圖表繪製環境。您學到的技能是可以轉移的。輕鬆使用 PlantUML、Mermaid、ECharts 建立圖表,或將來自 JSON 和 SQL 的資料視覺化——全部都在同一個地方完成。
以及更多功能
視覺化 SQL、JSON、YAML、Markmap 心智圖和其他格式。
與 Visual Paradigm Suite 無縫整合
您的 Graphviz 編輯器是 Visual Paradigm 生態系統的核心元件,可確保從初步概念到最終文件的流暢工作流程。
透過 AI 產生,用 VPasCode 完美呈現
使用 Visual Paradigm AI Diagramming Chatbot 從純文字產生複雜的 Graphviz 圖表。然後,在您的 Graphviz 編輯器中開啟產生的 DOT 程式碼,以微調每一個細節。
立即試用 AI 圖表聊天機器人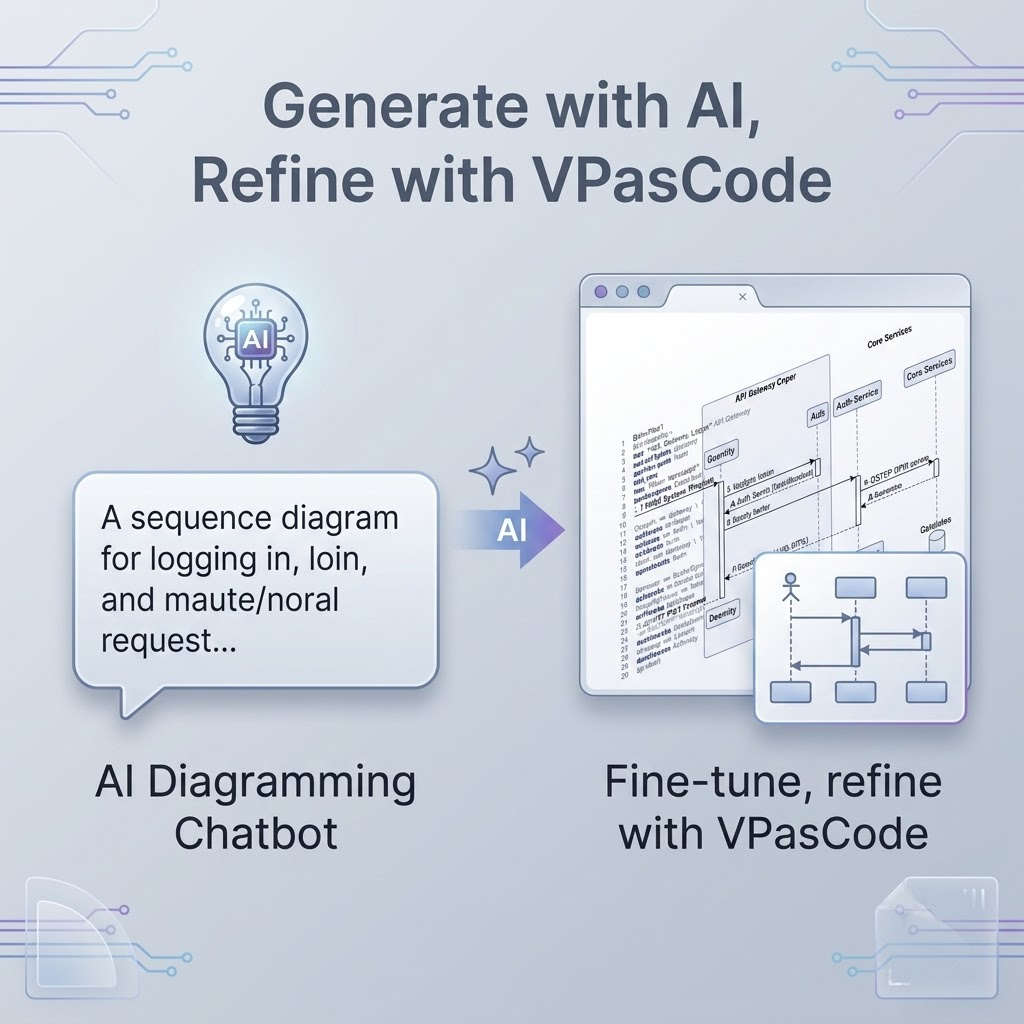
將圖表連接至文件
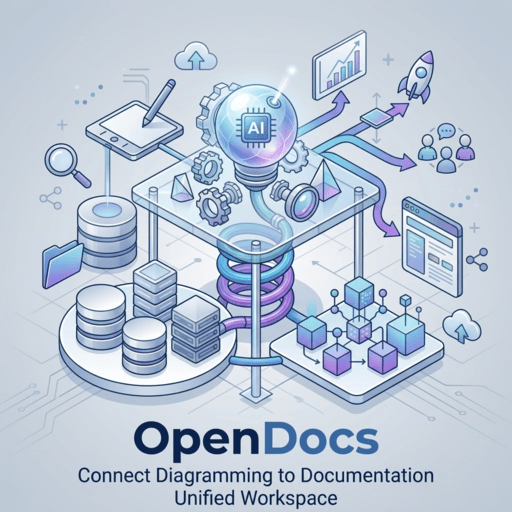
圖表通常是較大故事的一部分。只需按一下,即可將您從 Graphviz 工具完成的工作直接傳送至 Visual Paradigm OpenDocs,以建立豐富、可分享的知識庫與專案文件。
受到全球領先團隊的信賴
我們的 Graphviz 編輯器和更廣泛的建模平台被全球最成功公司的專業人士所使用。







準備好掌握您的圖表配置了嗎?
停止手動編譯 DOT 程式碼。立即使用網路上最棒的 免費 Graphviz 編輯器 開始視覺化您的圖表。無需下載。
您的 Graphviz 編輯器問題解答
什麼是 Graphviz 編輯器?
Graphviz 編輯器是用於編寫 DOT 語言 指令碼並將其算繪成圖形的工具。VPasCode Graphviz 編輯器是一個即時工具,可立即將您的 DOT 程式碼視覺化,讓您輕鬆建立和偵錯複雜的 網路圖表、組織圖、資料結構和其他抽象圖形。
Visual Paradigm VPasCode 支援 AI 圖表產生嗎?
是的!VPasCode 具有內建的原生 AI 圖表產生 功能。
只需輸入自然語言提示(例如「在 Graphviz 中產生網路拓樸圖」或「使用 DOT 語言建立相依性樹狀結構」),VPasCode 就會立即編寫程式碼並在編輯器內原生算繪圖表。
我可以在 VPasCode 中編輯 AI Chatbot 圖表嗎?
可以!您可以使用獨立的 Visual Paradigm AI Diagramming Chatbot 產生初始圖表概念,然後直接在 VPasCode 內開啟這些 DOT 指令碼,以執行進一步的程式碼編輯、微調節點屬性或翻譯文字標籤。
這是一個免費的 Graphviz 編輯器嗎?
是的,我們 Graphviz 編輯器的所有核心圖表功能都是免費的。這包括用於 DOT 語言的即時算繪編輯器以及匯出為 SVG/PNG 功能。進階功能(例如 AI 語法修正)則可在我們的付費版本中使用。
什麼是 DOT 語言?
DOT 是 Graphviz 使用的圖形描述語言。它允許您以簡單的文字格式定義圖形的結構與屬性。例如,'digraph G { A -> B }' 描述了一個簡單的有向圖,其中節點 A 指向節點 B。我們的 Graphviz 工具就是為了算繪此語言而設計的。
我什麼時候應該使用 Graphviz 而不是其他工具?
Graphviz 擅長自動配置複雜的抽象圖形與網路圖表。雖然像 Mermaid 或 PlantUML 這類的工具通常更適合用於流程圖或循序圖等結構化圖表,但此 Graphviz 工具的自動配置演算法在 視覺化複雜關係、相依性和網路拓樸方面更為優異。
如何匯出或分享我的 Graphviz 圖表?
您可以將算繪好的圖表匯出為 PDF 文件、用於清晰縮放的向量檔案 (SVG) 或高解析度影像 (PNG)。您也可以產生直接網頁連結來分享您的即時圖表,或直接將點陣圖複製到剪貼簿以貼入文件和簡報中。