Working with Table
You can present project data neatly with the use of table. In this section we will introduce the various kinds of table you can create in a Doc Base, and explain how to create such tables by writing Doc Fields. We assume that you have the basic knowledge of Doc Field. If you don't, please read the previous sections.
Let's begin by studying the following example, which consists of a table in a Doc Base, with an ${ELEMENT} Doc Field placed in the second row of the table.
| Use Cases in Project |
|---|
| ${ELEMENT, "List of Use Cases", UseCase, LoopInProject, PROPERTY=name} |
Suppose the Doc Base is applied on a project that contains the design specification of an ATM. Here is the sample outcome:
| Use Cases in Project |
|---|
| Withdraw Cash |
| Transfer Cash |
| Donate Money |
| Pay Bills |
Based on the outcome, you can see:
- The row that contains the Doc Field replicate itself to list out all the elements queried.
- In each row, the name of use case is output, which is the result of using PROPERTY=name in the Doc Field.
While this example output the name of use case, you can output complex content with the use of an element template. You just need to replace PROPERTY=name with the name of that template.
The example above is perhaps a bit simple. Let's extend it to make it a bit more complicated and closer to practical usage. Let's study this table:
| Use Cases in Project | ID | Description |
|---|---|---|
| ${ELEMENT, "List of Use Cases", UseCase, LoopInProject, PROPERTY=name} |
${PROPERTY, "userID"} | ${PROPERTY, "description"} (to be confirmed) |
We have added two more columns into the table, one for displaying the ID of use cases and another for displaying the description of use cases. Again, if we apply the Doc Base on an ATM project, here is the sample outcome:
| Use Cases in Project | ID | Description |
|---|---|---|
| Withdraw Cash |
UC01 |
Get cash from the ATM. (to be confirmed) |
| Transfer Cash | UC02 | Transfer cash from one account to another. (to be confirmed) |
| Donate Money | UC03 | Donate money to a chosen charity (to be confirmed) |
| Pay Bills | UC04 | Settle bills (to be confirmed) |
Based on the outcome, you can see:
- In order to output multiple properties of an element, add extra columns into the table and use ${PROPERTY} to output those properties.
- You can format table content, like the green text you see above.
- You can add your own text into table cells.
You may also want to present the icons of querying element. The following example gives you some ideas how to achieve it.
| Model Elements in a Class Diagram | Or if you want a column of icons |
|---|---|
| ${ELEMENT, "List of Model Elements", , LoopInDiagram, ICON} ${PROPERTY, "name"} |
${ICON} |
Here is the sample output when applying the above Doc Base on an ATM project, with a class diagram chosen to be the source of elements to query.
| Model Elements in a Class Diagram | Or if you want a column of icons |
|---|---|
You may also output diagram images using ${IMAGE}. Here is an example:
| All Diagrams in Project | Diagram Image |
|---|---|
| ${DIAGRAM, "All Diagrams", , LoopInProject, PROPERTY=name} |
${IMAGE} |
Here is the sample output when applying the above Doc Base on an ATM project.
| All Diagrams in Project | Diagram Image |
|---|---|
| ATM Use Case Model |
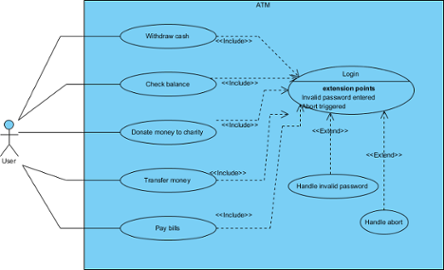 |
| Domain Class Model | 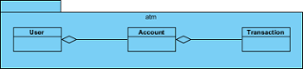 |
| NOTE: | ${PROPERTY}, ${ICON} and ${IMAGE} can only be used inside a table cell. |
Related Resources
The following resources may help you to learn more about the topic discussed in this page.
| 12. Using Custom Text | Table of Contents | 14. Managing Doc Templates in Team Environment |