Performing Maturity Analysis
What is the capability level of your development team? Which part of your team requires strengthening or optimization? What is the focus areas that will support your development activities? With a maturity model, you can easily find answers to all these questions.
Maturity analysis is the process to determine the level of maturity of a given set of factors. Usually it's done by creating a maturity model, like the one below.
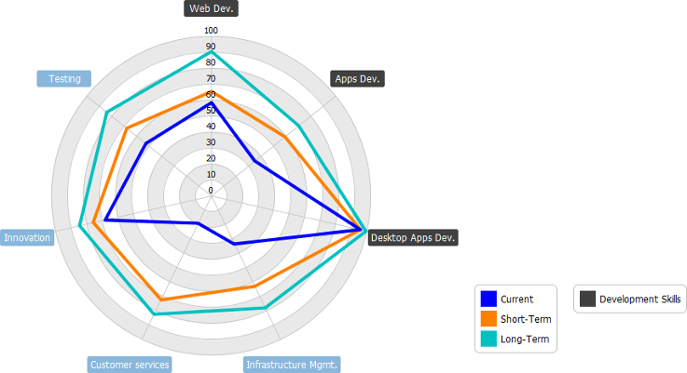 |
| Maturity model example |
The figure above shows an example of maturity model. It represents the level of maturity of various capabilities a team required to complete a software project. There are three stages of maturity, the current level of maturity represented in blue. The short term and long term taget are in orange and green, respectively. In each stage, a score (1 to 100) is given to each capability, indicating the level of maturity a capability has at that stage. Besides, the capabilities of web development, apps development and desktop applications development are grouped to a process area called Development Skills. By focusing on that particular process area you can clearly see the team's capability in developing applications for different platforms and devices.
Here are the key components of a maturity model:
- Maturity factor: A factor to be assessed for its level for maturity. It can be a capability a project required, or a particular area of interest.
- (Maturity) Score: The level of maturity, from 0 to 100. 0 means completely immature, while 100 means fully matured. It's not a must to aim for a maturity score of 100. Usually, it's subject to the team's need in setting a reasonable target score.
- Stage: A milestone. Stages are used to represents the the maturity of level in particular in time. While current stage represents the current level of capability, the short term and long term stages represent the score to team aim to reach at different points of development. You can rename the stages to suit your need. When scores are given to factors in different stages, gaps between the current and the expected level of maturity (i.e. the score difference) can be found.
- Process area: A way to group similar or related factors.
Creating a maturity model
- Select Diagram > New from the application toolbar.
- In the New Diagram window, select Radar Chart.
- Click Next.
- Enter the name and description. The Location field enables you to select a model to store the diagram.
- Click OK. This creates an maturity model with three anonymous factors and two stages. You can rename them and add more factors and stages. Then, adjust the score of each factor.
Adding a maturity factor
To add a maturity factor, right click on the model and select Add Variable... from the popup menu. Then, name the factor and press Enter to confirm.
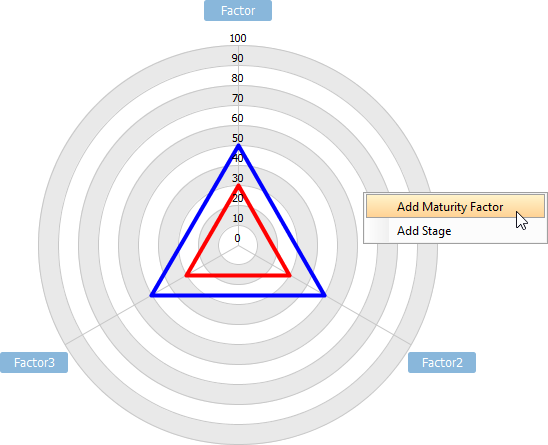 |
| Adding a maturity factor |
Giving a maturity score to a factor
To give a score to a factor, simply press on the intersection of the stage and factor and drag it back and forth to adjust the score.
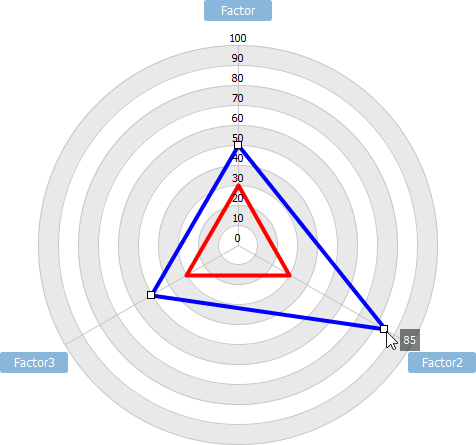 |
| Giving a maturity score to a factor |
Adding a stage
To add or to insert a stage, right click on a stage in the stage legend and then select Insert Stage Above or Insert Stage Below from the popup menu. You can also right click on the empty area of the legend and select Add Stage from the popup menu. Name the stage and press Enter.
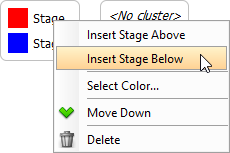 |
| Adding a stage |
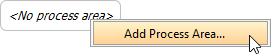
Adding a process area
To add a process area, right click on the process area legend and select Add Process Area... from the popup menu. Then, select the factors to be included in the process area and click OK.
 |
| Adding a process area |
Related Resources
The following resources may help you to learn more about the topic discussed in this page.
| Chapter 1. Maturity Analysis | Table of Contents | Chapter 2. Implementation Plan Diagram |