Matrix Diagram Example - Occurrence of Glossary Terms
Glossary is a function to allow you to identify important terms from name and description of model elements, so that you can build a glossary with terms and describe them in detail. For details about the use of glossary, please read the page Identify glossary term.
When you want to access the elements whose names or descriptions have terms included, you may form a matrix to illustrate the relationships between elements and terms. You can even see how frequent the terms are referred to in different model elements in a matrix view.
To create such matrix:
- Select Diagram > New from the application toolbar. In the New Diagram window, select Impact Analysis > Matrix Diagram. Click OK to confirm.
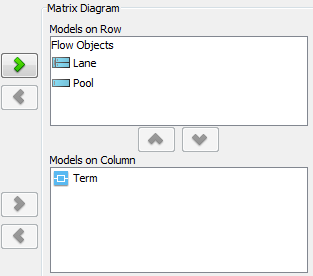
- Configure the matrix. If you want to place the terms at the top of matrix, add Term to Models on Column. If you want to place the terms on the left hand side of matrix, add Term to Models on Row.
Elements are selected for row and column - Select Using Term under the drop down menu By.
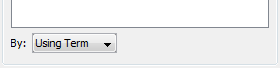
Select Using Term - Click OK. The ticks show in the matrix indicate the use of term for specific element.
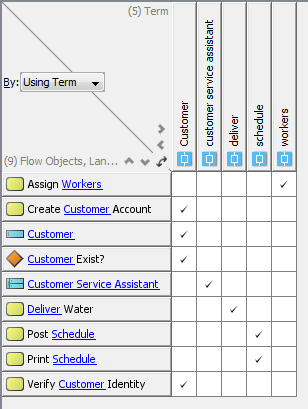
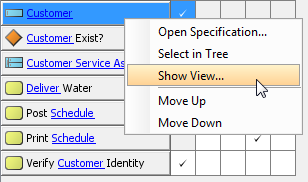
Matrix formed - If you want to open a view of a model element, right click on the element and select Show View... from the popup menu. in the Show View window, select the diagram to open and click Go to View.
Show view of pool
Related Resources
The following resources may help you to learn more about the topic discussed in this page.
| 2. Reading a matrix | Table of Contents | Chapter 4. Chart Diagram |