In today's rapidly evolving software landscape, the transition from monolithic applications to distributed microservices has fundamentally transformed how we design, deploy, and maintain systems. While this architectural shift delivers unprecedented agility and scalability, it introduces a new layer of complexity: understanding where software runs, how components communicate, and what infrastructure supports critical business functions.
This case study explores the pivotal role of UML Deployment Diagrams as the essential blueprint for navigating modern infrastructure complexity. Through practical examples, real-world scenarios, and actionable guidance, we demonstrate how deployment diagrams serve as the connective tissue between abstract software design and tangible hardware reality. Whether you're architecting an embedded system, scaling a client/server application, or orchestrating a global microservices ecosystem, this guide provides the framework to visualize, plan, and document your deployment topology with precision and confidence.
By the end of this case study, you will understand not only what deployment diagrams are, but how to leverage them as living documentation that aligns development, operations, security, and business stakeholders around a shared understanding of your system's physical architecture.
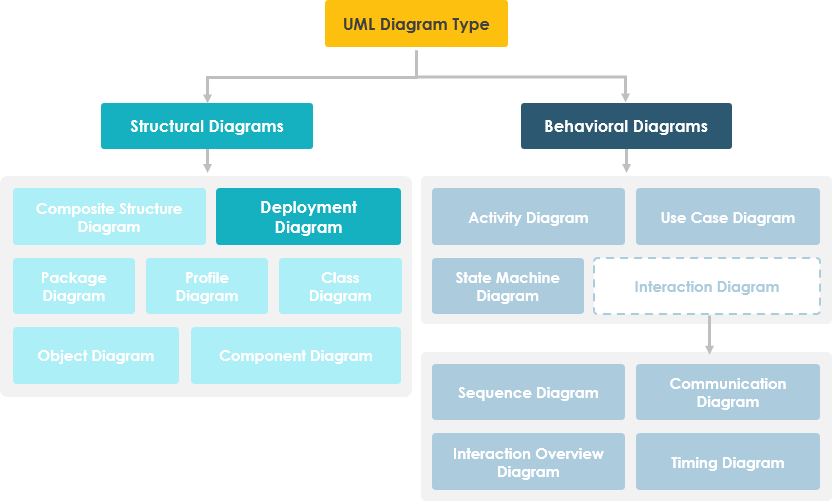
A UML deployment diagram is a structural diagram that shows the configuration of run-time processing nodes and the components that live on them. It models the physical aspects of an object-oriented system, capturing the static deployment view—the topology of hardware, software artifacts, and communication pathways.
Deployment diagrams provide critical insights during architectural planning and operational readiness:
What existing systems will the newly added system need to interact or integrate with?
How robust does the system need to be (e.g., redundant hardware for failover)?
What and who will connect to the system, and through what interfaces?
What middleware, operating systems, and communication protocols will be used?
What hardware and software will users directly interact with?
How will you monitor the system once deployed?
What security controls (firewalls, physical security) are required?
Visualize the structure of the run-time system
Capture hardware infrastructure and interconnections
Model physical elements and communication paths
Plan system architecture proactively
Document software component deployment for audit and maintenance
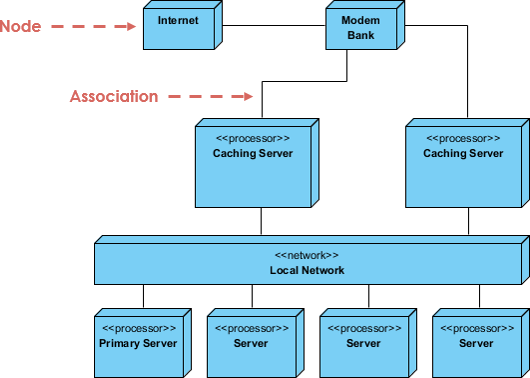
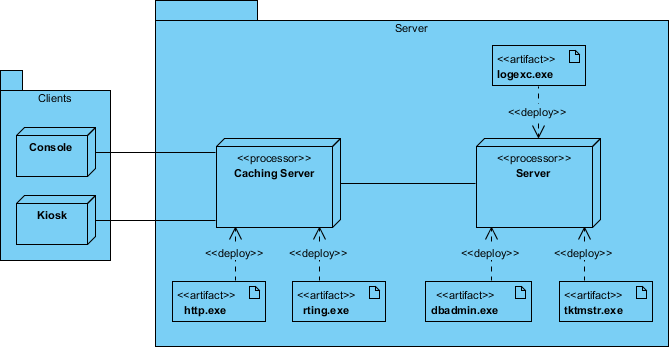
Deployment diagrams are a specialized form of class diagram focused on system nodes. Graphically, they consist of vertices (nodes) and arcs (connections).
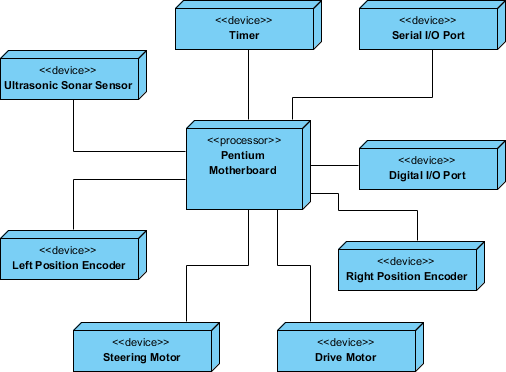
Represented as 3-D boxes (cubes) for hardware or software execution environments
Hardware nodes can be marked with <<device>> or <<processor>> stereotypes
Connections between nodes use lines, optionally labeled with protocol stereotypes (<<TCP/IP>>, <<HTTPS>>)
Nodes can nest within other nodes to represent hierarchical infrastructure
Dependencies: Dashed arrows showing artifact reliance
Associations: Solid lines indicating communication relationships
Notes and Constraints: Text annotations for clarifications or rules
Scenario: Designing firmware deployment for an IoT medical monitoring device.
Approach:
Identify unique devices: sensor modules, edge processors, cloud gateways
Apply stereotypes for visual clarity: <<sensor>>, <<edge-node>>, <<cloud-gateway>>
Model relationships: data flow from sensor → edge processor → cloud
Expand intelligent devices with nested deployment views for internal architecture
Outcome: Clear visualization of data pathways, failure points, and update mechanisms enabled proactive reliability engineering and simplified field maintenance procedures.
Scenario: Modernizing a legacy HR platform with web clients, application servers, and database clusters.
Approach:
Identify client nodes (web browsers, mobile apps) and server processors (app servers, DB clusters)
Highlight architecturally significant devices: load balancers, authentication gateways
Apply stereotypes: <<web-client>>, <<app-server>>, <<database-cluster>>
Model topology with communication protocols: <<HTTPS>>, <<JDBC>>
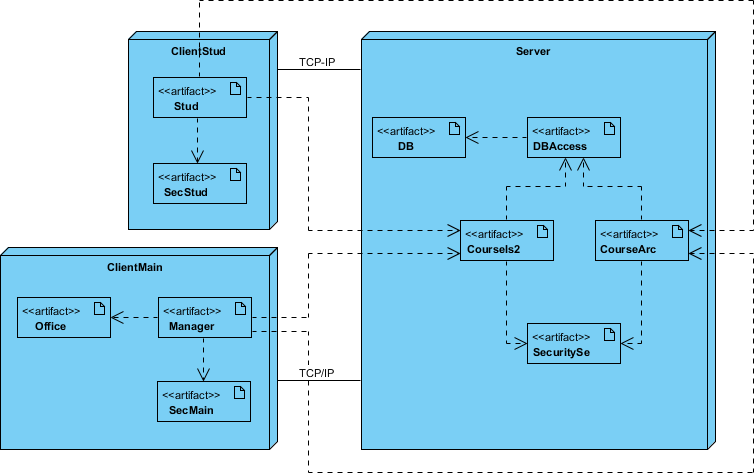
Outcome: The diagram facilitated infrastructure provisioning, security zoning, and performance testing by making network dependencies explicit before code deployment.
Scenario: Scaling a microservices-based e-commerce platform across multiple geographic regions.
Approach:
Identify devices and processors per region: regional API gateways, container clusters, CDN nodes
Model communication infrastructure: WAN links, message queues, service meshes
Use packages to group nodes by logical function or geographic zone
Reify the network itself as nodes: <<Internet>>, <<Regional-LAN>>, <<CDN>>
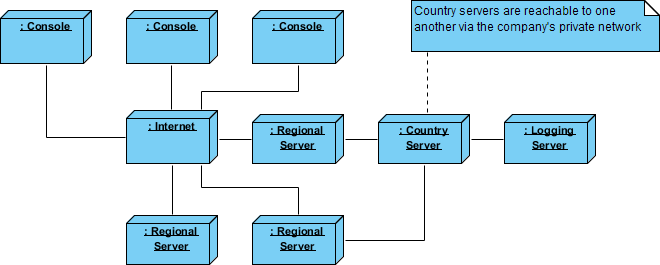

Outcome: The deployment diagram became the single source of truth for disaster recovery planning, latency optimization, and compliance auditing across jurisdictions.
"In the landscape of modern software engineering, the shift from monolithic applications to distributed microservices architectures has become standard practice. While this transition offers agility and scalability, it introduces a significant layer of complexity regarding infrastructure and connectivity."
When decomposing applications into microservices, several risks emerge without proper visualization:
Network Ambiguity: Unclear service-to-service communication paths through firewalls or service meshes
Resource Contention: Difficulty identifying over/under-provisioned infrastructure
Deployment Failures: Unmapped dependencies causing cascading failures during releases
Onboarding Friction: New engineers struggle to understand physical system layout
Solution: Deployment diagrams abstract physical infrastructure while preserving logical connections—acting as a contract between software logic and hardware reality.
Nodes represent computing resources where software executes:
| Node Type | Examples | Use Case |
|---|---|---|
| Compute Instances | AWS EC2, Azure VMs | General-purpose application hosting |
| Container Hosts | Docker Engine, containerd | Isolated microservice runtime |
| Orchestration Engines | Kubernetes, Nomad | Cluster-wide service scheduling |
| External Systems | Legacy DBs, third-party APIs | Integration boundaries |
Deployable units installed onto nodes:
Application Archives: Docker images, JAR files, executable binaries
Configuration: YAML manifests, environment variables, secrets
Database Schemas: Migration scripts, data models
Libraries: Shared dependencies, SDKs
Labeled lines indicating data flow protocols:
<<HTTP/REST>> – Synchronous API calls
<<gRPC>> – High-performance service communication
<<Kafka>> – Asynchronous event streaming
<<TLS>> – Encrypted channel indicator
Distinct from communication: shows where an artifact runs, not how it talks.
| Strategy | Best For | Pros | Cons |
|---|---|---|---|
| Single Instance | Internal tools, low-traffic services | Low cost, simple config | Single point of failure |
| Active-Active Cluster | Critical user-facing services | High availability, load balancing | Complex state management |
| Stateless Placement | API gateways, workers | Easy scaling, quick restarts | No local session storage |
| Stateful Placement | Databases, caches | Data persistence, performance | Complex replication, backups |
Use boundary boxes or packages to group related nodes:
All "Payment Service" instances → grouped cluster
Nodes in us-east-1 → geographic zone boundary
Shared infrastructure → "Platform Services" package
This abstraction reduces cognitive load while preserving architectural intent.
Firewalls and Gateways
Show public vs. internal network zones
Position API gateways relative to backend services
Indicate authentication boundaries
Encryption and Protocols
Label connections: <<HTTPS>>, <<TLS 1.3>>, <<Internal-Plaintext>>
Visual cues prompt security reviews and compliance checks
Secrets Management
Include dedicated nodes for secrets managers (HashiCorp Vault, AWS Secrets Manager)
Show injection pathways without exposing actual credentials
Horizontal Scaling: Multiple identical nodes behind a load balancer → indicates traffic distribution capability
Vertical Scaling: Single node with resource labels (CPU: 16 vCPU, RAM: 64GB) → indicates capacity limits
Include on-node metadata:
Node: app-server-prod-01
• CPU: 8 vCPU
• Memory: 32 GB RAM
• Storage: 500 GB SSD
• Network: 10 Gbps
• Region: us-west-2
These annotations enable proactive capacity planning and bottleneck identification.
Maintain separate diagram views or use color-coding for environments:
| Environment | Topology Characteristics | Purpose |
|---|---|---|
| Development | Single node, all services co-located | Local testing, rapid iteration |
| Staging | Production-like, reduced capacity | Performance validation, UAT |
| Production | Full redundancy, multi-region | Live traffic, business continuity |
Link diagrams to Infrastructure-as-Code (Terraform, CloudFormation)
Use scripts to parse IaC and auto-generate diagram updates
Schedule regular audits: compare live infrastructure vs. documented topology
Flag unauthorized changes for security and compliance review
| Pitfall | Impact | Mitigation |
|---|---|---|
| Over-Complication | Unreadable diagrams, stakeholder confusion | Aggregate nodes into clusters; use layered views |
| Outdated Information | Misguided decisions, operational risk | Assign diagram ownership; integrate with change management |
| Ignoring Network Latency | Performance surprises in production | Annotate geographic regions; model WAN links explicitly |
| Mixing Logical/Physical Views | Architectural ambiguity | Maintain separate diagrams; cross-reference with clear labels |
Deployment diagrams serve as a universal language bridging organizational silos:
Understand runtime environment constraints
Identify service dependencies and integration points
Clarify ownership boundaries for observability and debugging
Accelerate incident triage with visual failure-path tracing
Plan capacity upgrades using resource annotations
Document runbooks with topology-aware procedures
Audit network exposure and data flow encryption
Validate compliance with zoning and access policies
Baseline penetration testing scope against documented architecture
Estimate infrastructure costs from node counts and resource specs
Plan budgets for scaling initiatives
Communicate technical strategy to non-technical stakeholders
Store diagram files in Git alongside code repositories
Use meaningful commit messages: "Add Redis cluster for session caching"
Enable diffing to track architectural evolution over time
Parse Kubernetes manifests, Terraform configs, or Docker Compose files
Use tools like Visual Paradigm AI to generate initial diagrams from text descriptions
Reduce human error and maintenance overhead
Include diagram reviews in sprint retrospectives or quarterly architecture councils
Ask critical questions:
"Do we still need this legacy integration node?"
"Has this service's scaling pattern changed?"
"Are our security boundaries still aligned with compliance requirements?"
This practice prevents architectural drift and technical debt accumulation.
Modern tools leverage AI to accelerate deployment diagram creation:
Generate initial deployment views from system requirements
Define 3D nodes, communication protocols, and artifact manifestations
Maintain industry-standard UML precision with AI assistance
Describe infrastructure in natural language: "Show me a 3-node Kubernetes cluster with PostgreSQL and Redis"
Instantly generate editable, standards-compliant diagrams
Iterate rapidly through conversational refinement
AI Deployment Capabilities:
• Identify hardware nodes & devices
• Model communication protocols
• Visualize artifact distribution
• Plan system installation topology
Explore AI Capabilities | Full AI Ecosystem
Use this checklist when drafting deployment plans:
Who installs the system? What's the estimated duration?
What are potential failure points? What's the rollback procedure?
What is the maintenance window? Are backups completed?
Is data conversion required? How is success validated?
How are concurrent versions handled? What's the migration strategy?
What physical sites require deployment? In what sequence?
How are support and operations staff trained?
Is a production-like support environment needed for troubleshooting?
What documentation formats and languages are required?
How are documentation updates distributed and versioned?
In an era where software systems grow increasingly distributed, dynamic, and complex, the ability to visualize infrastructure is not a luxury—it is a strategic necessity. UML Deployment Diagrams provide the foundational language to transform abstract architectural concepts into actionable, communicable, and maintainable blueprints.
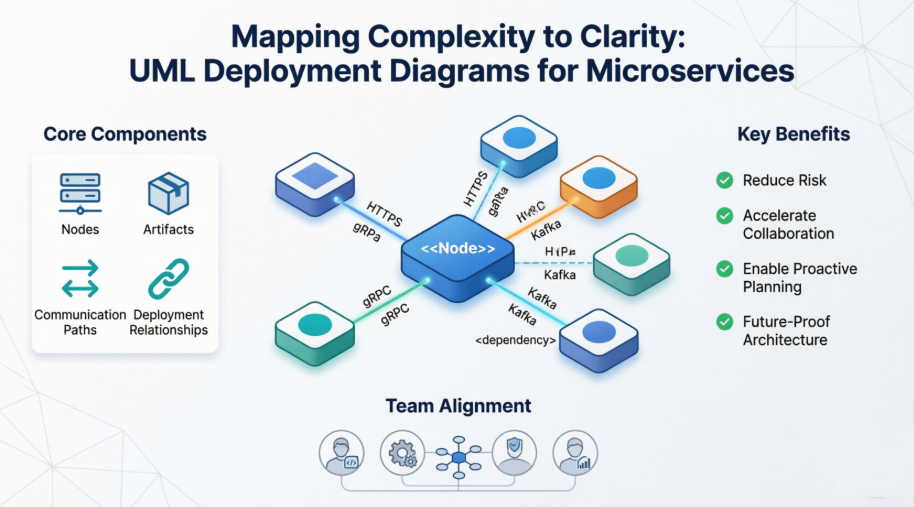
This case study has demonstrated that deployment diagrams are far more than static documentation artifacts. When properly crafted and maintained, they:
✅ Reduce Risk by making dependencies, failure points, and security boundaries explicit before deployment
✅ Accelerate Collaboration by providing a shared visual language across development, operations, security, and business teams
✅ Enable Proactive Planning by supporting capacity modeling, disaster recovery design, and compliance auditing
✅ Future-Proof Architecture by creating living documentation that evolves with your system through version control and automation
As you embark on your next architectural initiative—whether modernizing a legacy system, scaling a microservices platform, or deploying an IoT ecosystem—invest time in crafting a clear, accurate, and collaborative deployment diagram. Treat it not as an afterthought, but as a first-class artifact in your engineering workflow.
"In a world where complexity is constant, clarity is the most valuable asset."
By embracing deployment diagrams as dynamic, AI-enhanced, team-owned artifacts, you equip your organization to navigate infrastructure complexity with confidence, agility, and precision. The map is not the territory—but without a reliable map, even the most talented team can lose their way.
Start mapping. Start clarifying. Start deploying with confidence. 🗺️✨