Code is written for machines to execute, but software is built by humans to solve human problems. The biggest point of failure in software development isn’t bad code; it’s misaligned expectations.
This is where Strategic UML (Unified Modeling Language) comes in. When used correctly, UML isn’t a bureaucratic hurdle or a relic of the waterfall era. It is a universal visual language that bridges the gap between technical developers and non-technical stakeholders, ensuring everyone is building the right thing before a single line of code is written.
This comprehensive tutorial will guide beginners through the core concepts of UML, provide hands-on examples, and introduce the modern tooling that keeps UML lightweight, version-controlled, and highly effective.
Part 1: The Core Philosophy of Strategic UML
For beginners, the most important rule of UML is: Model to communicate, not to document everything.
Tactical UML tries to map every single database column and method, resulting in "bloat" that stakeholders ignore and developers hate maintaining. Strategic UML focuses on the "Big Picture":
- For Stakeholders: It answers "What does the system do, and how does the user interact with it?"
- For Developers: It answers "How do the components talk to each other, and what is the data structure?"
Part 2: Key UML Concepts for Beginners (The "Big 3")
You don’t need to learn all 14 UML diagram types. To bridge the gap between teams, master these three:
1. Use Case Diagram (The "What")
- Purpose: Shows the system’s functionality from the user’s perspective.
- Audience: Highly stakeholder-friendly. No technical jargon.
- Key Elements: Actors (stick figures representing users or external systems) and Use Cases (ovals representing goals, e.g., "Login", "Process Payment").
2. Sequence Diagram (The "How")
- Purpose: Illustrates how objects or systems interact with each other over time to complete a specific task.
- Audience: Perfect for aligning product managers (who care about the user flow) and developers (who care about API calls and system boundaries).
- Key Elements: Lifelines (vertical lines representing systems/actors) and Messages (horizontal arrows representing requests/responses).
3. Class Diagram (The "Structure")
- Purpose: Shows the static structure of the system, including classes, attributes, and relationships.
- Audience: Primarily for developers and architects, but high-level versions help stakeholders understand core business entities (e.g., "An Order has many Line Items").
- Key Elements: Classes (boxes divided into name, attributes, and methods) and relationships (inheritance, composition, association).
Part 3: Hands-On Example (PlantUML)
Let’s look at a Sequence Diagram for a "User Login Flow with Multi-Factor Authentication (MFA)." This is a perfect example of bridging the gap: a stakeholder can read the plain-English steps, while a developer sees the exact system boundaries and API handoffs.
We will use PlantUML, a "diagrams as code" tool.
The PlantUML Code
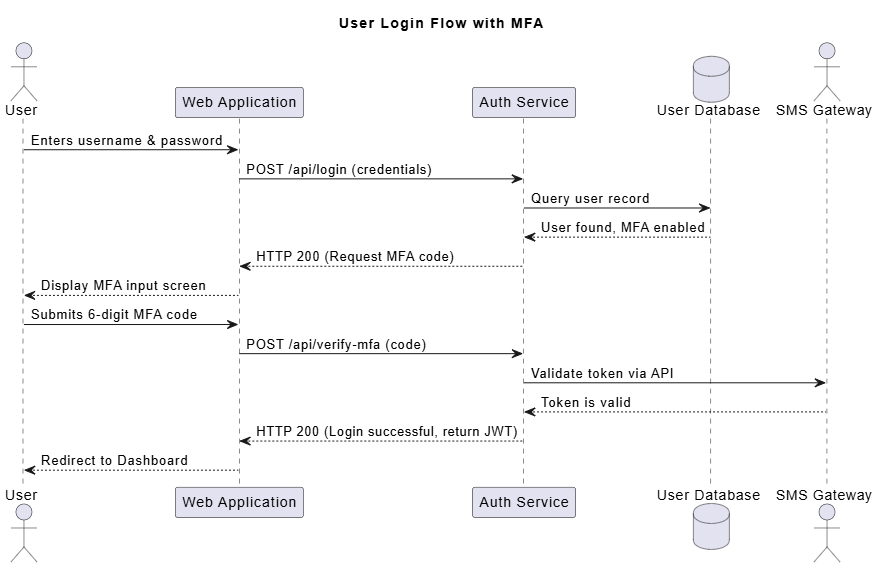
@startuml
title User Login Flow with MFA

actor User
participant "Web Application" as Web
participant "Auth Service" as Auth
database "User Database" as DB
actor "SMS Gateway" as SMS

User -> Web: Enters username & password
Web -> Auth: POST /api/login (credentials)
Auth -> DB: Query user record
DB --> Auth: User found, MFA enabled
Auth --> Web: HTTP 200 (Request MFA code)
Web --> User: Display MFA input screen

User -> Web: Submits 6-digit MFA code
Web -> Auth: POST /api/verify-mfa (code)
Auth -> SMS: Validate token via API
SMS --> Auth: Token is valid
Auth --> Web: HTTP 200 (Login successful, return JWT)
Web --> User: Redirect to Dashboard

@enduml
Why this bridges the gap:
- Stakeholder View: They can easily trace the user journey: Enter password -> Get prompted for code -> Enter code -> See dashboard.
- Developer View: They immediately know they need a
POST /api/login endpoint, an Auth Service, a database check, and an integration with an SMS Gateway.
- The Magic: Because it’s written in text, it’s easy to tweak during a meeting. "Should we check the DB before asking for the MFA code?" You can change the code in seconds and re-render.
Part 4: Modern Tooling: Keeping UML "Bloat-Free"
To keep UML "bloat-free," use tools that integrate into your modern workflow and automate the heavy lifting. Today’s ecosystem ranges from lightweight text-based renderers to AI-powered enterprise suites.
- Mermaid.js: Built directly into GitHub, GitLab, Notion, and Obsidian. You write simple text, and it renders a diagram on the fly. It’s the ultimate tool for keeping diagrams version-controlled right next to your code in your Markdown files.
- PlantUML: The veteran of "diagrams as code." It is highly powerful, supports a massive variety of diagram types, and has a massive ecosystem of IDE plugins (VS Code, IntelliJ) for real-time previewing.
- Visual Paradigm (AI-Powered & OpenDocs): While traditionally known as a heavy-duty enterprise modeling tool, modern Visual Paradigm has evolved to actively fight bloat through automation.
- VPasCode: A unified "Diagram as Code" rendering and editing platform that brings the speed of text-based modeling to enterprise-grade tooling.
- AI & Chatbot Integration: It now features built-in AI assistants and chatbots that can generate UML diagrams directly from natural language prompts (e.g., "Create a sequence diagram for a user login flow with MFA"). This drastically reduces the time spent drawing and lowers the barrier to entry for beginners.
- Visual Paradigm OpenDocs: One of the biggest sources of UML bloat is manually writing and updating documentation. Visual Paradigm’s OpenDocs feature automatically generates comprehensive, living documentation (HTML, Word, PDF) directly from your models. Combined with its OpenAPI support, it ensures your visual models and technical specs are always perfectly synchronized, eliminating outdated "zombie" documentation.
Part 5: Tips and Tricks for Beginners
- Start Whiteboard, End in Code: Never start by typing PlantUML or dragging boxes in a GUI. Start with a whiteboard or a piece of paper with your stakeholders. Get the logic right first, then formalize it in code.
- Embrace "Diagrams as Code": Store your
.puml or .md (Mermaid) files in your Git repository alongside your application code. When a developer updates the API, they update the diagram in the same Pull Request. This guarantees your diagrams never become "zombie" artifacts.
- Use the 80/20 Rule: Focus on the 20% of the system that causes 80% of the confusion. You don’t need a diagram for a simple CRUD operation. Use UML for complex workflows, new microservice integrations, or ambiguous business rules.
- Name Things Clearly: In Sequence and Class diagrams, avoid generic names like
System1 or Manager. Use domain-driven names like PaymentGateway, InventoryService, or Customer. This makes the diagram readable to business analysts.
- Leverage AI for First Drafts: Use tools like Visual Paradigm’s AI chatbot or GitHub Copilot to generate the initial PlantUML skeleton from a text description. It’s much easier to edit an AI-generated draft than to start from a blank screen.
Conclusion
UML is not about creating pretty pictures for an archive folder. When applied strategically, it is a powerful communication protocol. By focusing on the "Big 3" diagrams, adopting modern "Diagrams as Code" tooling, and leveraging AI to reduce friction, you can ensure that developers and stakeholders are always speaking the same language—long before the code is deployed to production.
Ready to start? Copy the PlantUML code above into VPasCode.com or a VS Code extension, and watch your first strategic diagram come to life.