The Context Diagram gave you the “who” and “what.” The Container Diagram gives you the “how” and “where.” It’s the sweet spot in the C4 model where technical reality meets architectural clarity.
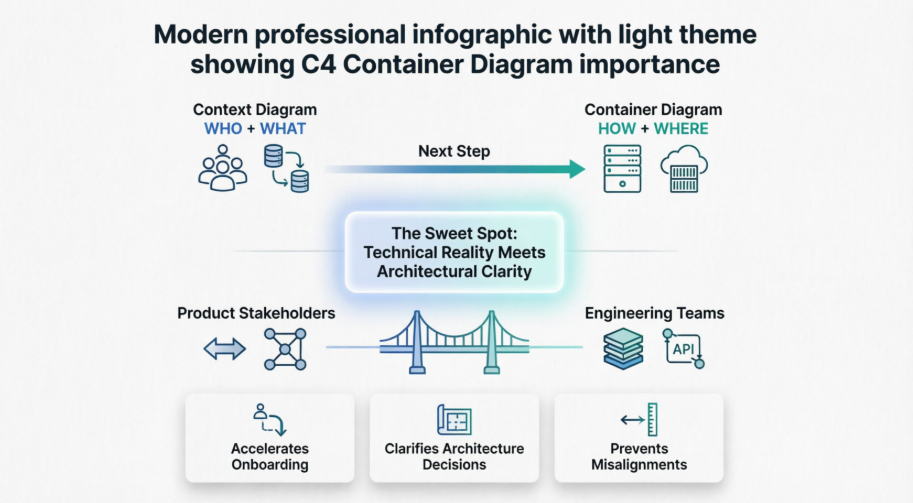
At this level, you stop talking in business abstractions and start mapping the actual deployable units that make your system run. You’ll bridge the gap between product stakeholders (who need to understand data flow and dependencies) and engineering teams (who need to know tech stacks, boundaries, and integration points). After reading this guide, you’ll be able to draft, review, and maintain a Container Diagram that accelerates onboarding, clarifies architecture decisions, and prevents costly misalignments.
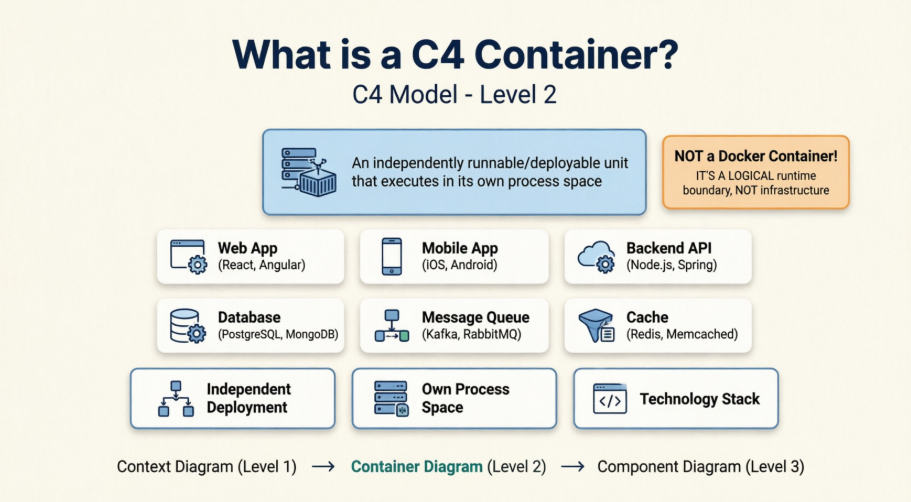
In the C4 model, a Container Diagram is Level 2. It zooms one level deeper than the Context Diagram by breaking your single “System in Scope” into its independently runnable or deployable pieces.
What “Container” actually means in C4:
A container is any application or data store that runs in its own process space. It is not necessarily a Docker container. It’s a logical runtime boundary. Examples: a web application, a mobile app, a backend API, a relational database, a message queue, or a file storage service.
How it differs from the Context Diagram (Level 1):
| Context Diagram (Level 1) | Container Diagram (Level 2) |
|---|---|
| Shows 1 system in scope | Breaks that system into multiple containers |
| Focuses on people & external systems | Focuses on technical building blocks |
| No technology details | Explicitly shows tech choices (e.g., React, PostgreSQL, Kafka) |
| For stakeholders & product teams | For developers, architects, DevOps, and tech leads |
Who should use it and when:
Engineering teams during system design, architecture reviews, incident post-mortems, and developer onboarding. Use it when you’re ready to decide tech stacks, plan deployments, or clarify data flow. Skip it if you’re still in early ideation or if the system is a single monolith with no external dependencies.
Customer Web App (React/TypeScript)Order API (Java/Spring Boot)PostgreSQL DatabaseRedis CacheRabbitMQ Message BrokerDevelopers get a clear map of dependencies. Architects can spot anti-patterns early. Stakeholders understand where data lives and how features are technically delivered. It becomes the single source of truth for technical onboarding.
| Element | Representation | Purpose |
|---|---|---|
| System Boundary | Dashed rectangle around containers | Groups all containers belonging to your system |
| Containers | Solid rectangles with tech tags | Independent runtime units (apps, DBs, queues) |
| Users | Person icons (optional) | Retains context from Level 1 |
| External Systems | Different color/style | Third-party services your containers talk to |
| Relationships | Directed arrows with labels + tech | Data flow, sync/async, protocol (e.g., HTTPS, JDBC, AMQP) |
| Technology Tags | Inside or below container boxes | Explicit stack choices (critical at this level) |
Step 1: Start from your Context Diagram
Keep your Level 1 diagram open. You’ll reuse the same users and external systems. Your single “System” box is now a boundary you’ll fill with containers.
Step 2: Break the system into containers
Ask: “What runs independently?” List web apps, APIs, databases, caches, queues. Keep it to 5–9 containers max.
Step 3: Add users and external systems
Place users on the left, external systems on the right. Keep the same names from your Context Diagram for consistency.
Step 4: Define relationships and technology
Draw arrows between containers. Label them with what flows + protocol. Add tech tags to every container (e.g., Node.js, MongoDB, gRPC).
Step 5: Add clear labels and legends
Use a consistent naming pattern: [Purpose] ([Technology]). Add a legend if you use custom colors or line styles.
Beginner Checklist:
@startuml
!include https://raw.githubusercontent.com/plantuml-stdlib/C4-PlantUML/master/C4_Container.puml
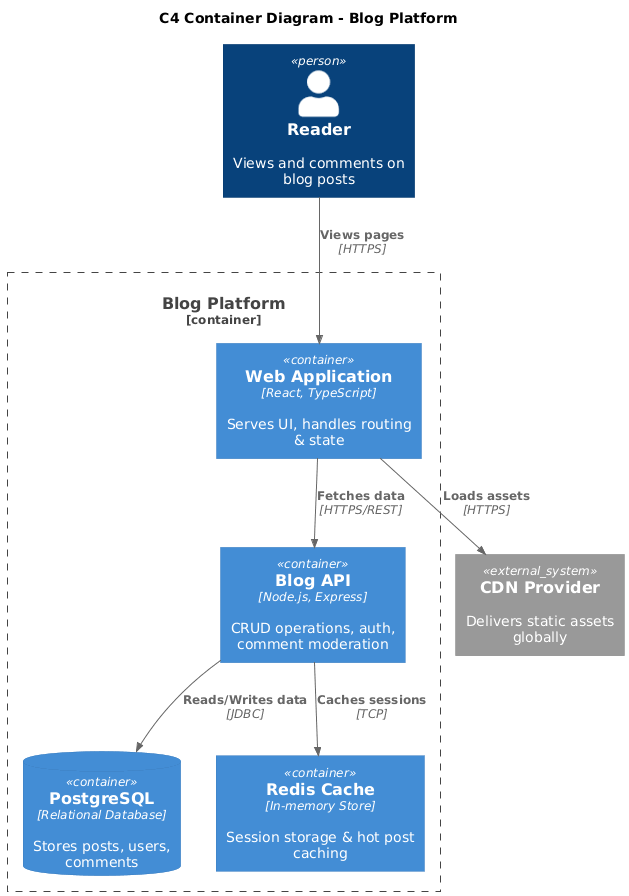
title C4 Container Diagram - Blog Platform
Person(user, "Reader", "Views and comments on blog posts")
System_Ext(cdn, "CDN Provider", "Delivers static assets globally")
Container_Boundary(blog_system, "Blog Platform") {
Container(web_app, "Web Application", "React, TypeScript", "Serves UI, handles routing & state")
Container(api, "Blog API", "Node.js, Express", "CRUD operations, auth, comment moderation")
ContainerDb(db, "PostgreSQL", "Relational Database", "Stores posts, users, comments")
Container(cache, "Redis Cache", "In-memory Store", "Session storage & hot post caching")
}
Rel(user, web_app, "Views pages", "HTTPS")
Rel(web_app, api, "Fetches data", "HTTPS/REST")
Rel(api, db, "Reads/Writes data", "JDBC")
Rel(api, cache, "Caches sessions", "TCP")
Rel(web_app, cdn, "Loads assets", "HTTPS")
@enduml
@startuml
!include https://raw.githubusercontent.com/plantuml-stdlib/C4-PlantUML/master/C4_Container.puml

title C4 Container Diagram - Task Manager Mobile App

Person(user, "Mobile User", "Creates and tracks daily tasks")

Container_Boundary(task_system, "Task Manager System") {
    Container(mobile_app, "iOS/Android App", "Swift, Kotlin", "Offline-first UI, local sync")
    Container(api_gateway, "API Gateway", "AWS API Gateway", "Route & throttle requests")
    Container(task_service, "Task Service", "Python, FastAPI", "Business logic, CRUD")
    ContainerDb(dynamo, "DynamoDB", "NoSQL Database", "Stores tasks & user profiles")
    ContainerQueue(queue, "SQS Queue", "Message Queue", "Async notification jobs")
    Container(notifier, "Notification Worker", "Node.js", "Sends push/email alerts")
}

System_Ext(apns, "Apple Push Service", "iOS notifications")
System_Ext(fcm, "Firebase Cloud Messaging", "Android notifications")

Rel(user, mobile_app, "Creates tasks", "HTTPS")
Rel(mobile_app, api_gateway, "Syncs data", "HTTPS")
Rel(api_gateway, task_service, "Routes requests", "HTTPS")
Rel(task_service, dynamo, "Persists tasks", "AWS SDK")
Rel(task_service, queue, "Enqueues alerts", "AWS SDK")
Rel(queue, notifier, "Triggers worker", "AMQP")
Rel(notifier, apns, "Sends iOS push", "HTTPS")
Rel(notifier, fcm, "Sends Android push", "HTTPS")

@enduml

@startuml
!include https://raw.githubusercontent.com/plantuml-stdlib/C4-PlantUML/master/C4_Container.puml
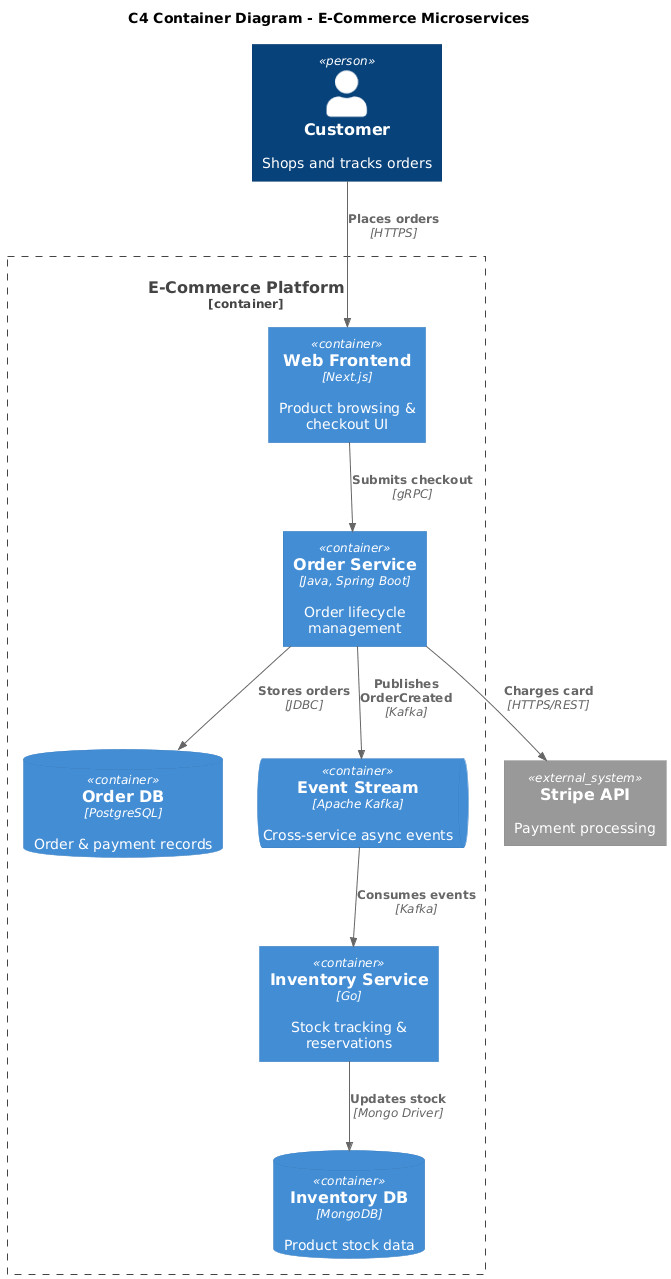
title C4 Container Diagram - E-Commerce Microservices
Person(customer, "Customer", "Shops and tracks orders")
Container_Boundary(ecommerce, "E-Commerce Platform") {
Container(frontend, "Web Frontend", "Next.js", "Product browsing & checkout UI")
Container(order_svc, "Order Service", "Java, Spring Boot", "Order lifecycle management")
Container(inventory_svc, "Inventory Service", "Go", "Stock tracking & reservations")
ContainerDb(order_db, "Order DB", "PostgreSQL", "Order & payment records")
ContainerDb(inv_db, "Inventory DB", "MongoDB", "Product stock data")
ContainerQueue(events, "Event Stream", "Apache Kafka", "Cross-service async events")
}
System_Ext(payment, "Stripe API", "Payment processing")
Rel(customer, frontend, "Places orders", "HTTPS")
Rel(frontend, order_svc, "Submits checkout", "gRPC")
Rel(order_svc, order_db, "Stores orders", "JDBC")
Rel(order_svc, events, "Publishes OrderCreated", "Kafka")
Rel(events, inventory_svc, "Consumes events", "Kafka")
Rel(inventory_svc, inv_db, "Updates stock", "Mongo Driver")
Rel(order_svc, payment, "Charges card", "HTTPS/REST")
@enduml
Poor: Boxes labeled Service1, DB, Queue with no tech tags, arrows labeled calls, uses, or missing entirely. Component details (classes, packages) mixed in.
Clear: [Purpose] ([Tech]) naming, explicit protocols on arrows, logical grouping, zero implementation leakage, readable data flow direction.
[Business Function] ([Technology]). Example: User Auth Service (Node.js), Analytics DB (ClickHouse).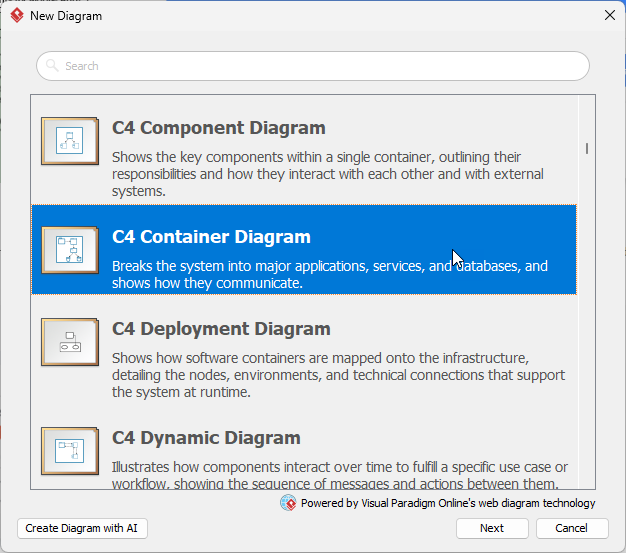
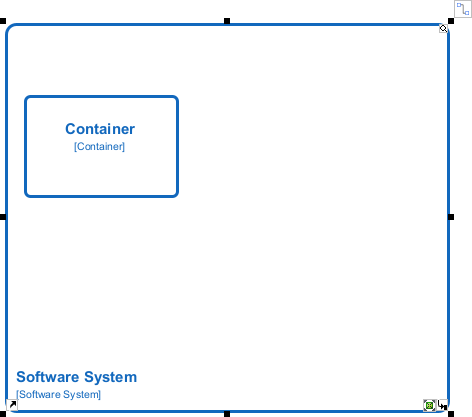
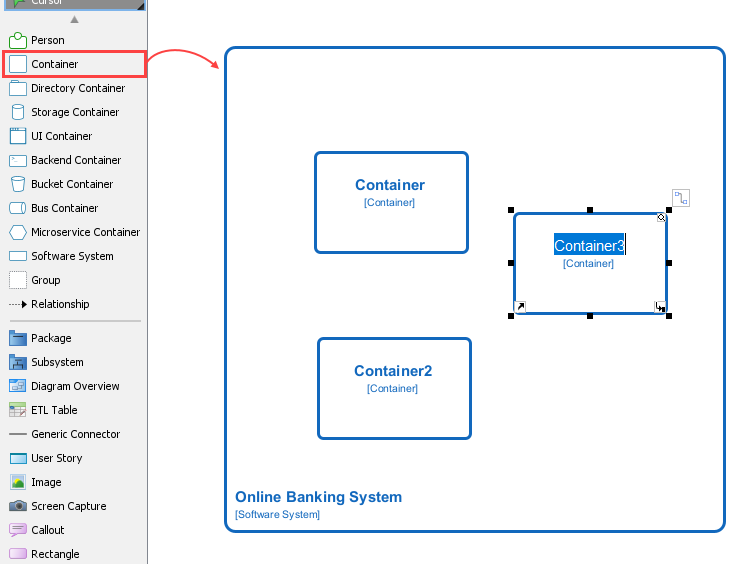
Container from the palette.

System Boundary around your containers.
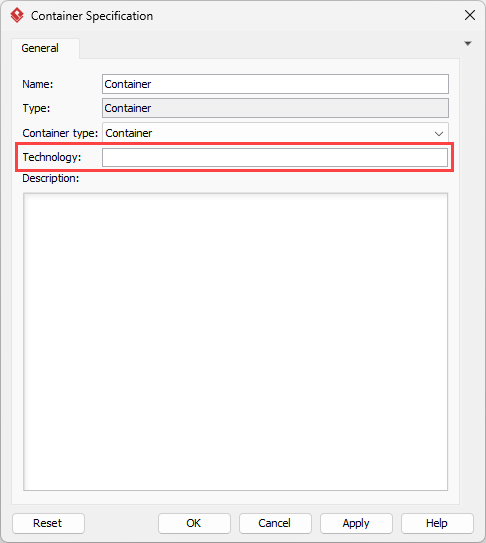
Relationship connectors; double-click to add labels & protocolOpen Specification → Fill Technology field
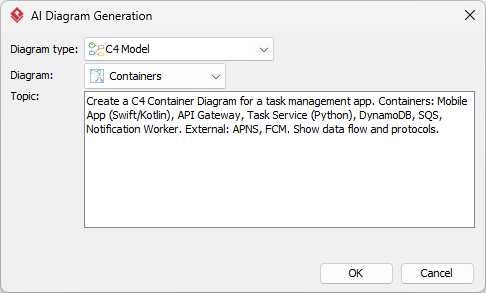
AI Diagram Generator (Tools > AI Diagram Generator). Select C4 Model to be the diagram type, Containers to be the diagram.Create a C4 Container Diagram for a task management app. Containers: Mobile App (Swift/Kotlin), API Gateway, Task Service (Python), DynamoDB, SQS, Notification Worker. External: APNS, FCM. Show data flow and protocols.
| Aspect | Traditional Manual | AI-Assisted |
|---|---|---|
| Control | High precision, custom styling | Fast baseline, requires tuning |
| Learning | Teaches C4 structure deeply | Accelerates drafting, needs verification |
| Best For | Complex domains, strict governance | Rapid prototyping, team alignment |
| Tech Tags | Manually added via properties | Often auto-inferred, always verify |
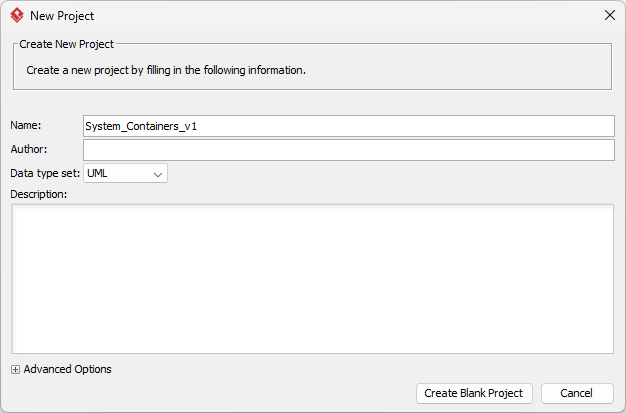
System_Containers_v1. Click Create Blank Project to confirm.
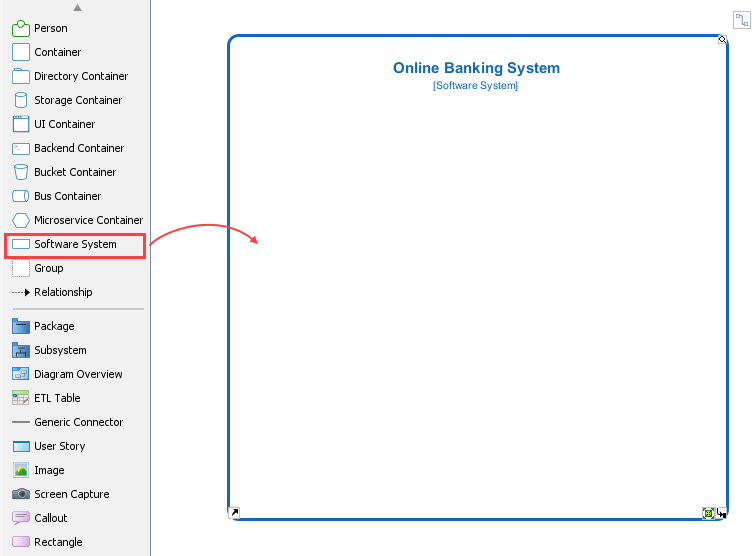
System Boundary shape. Rename it to your system name.
Container shapes.
System_Ext right.Relationship arrows. Double-click each arrow → add label + protocol.Open Specification panel → fill Technology field.Tools > AI Diagram GeneratorOK. VP places shapes, draws arrows, and applies C4 styling.sends data) with precise ones (publishes order events via Kafka)Open Specification panel for each shape.| Mistake | Why it’s wrong | How to fix it |
|---|---|---|
| Mixing Component-level details too early | Shows packages, classes, or internal modules | Delete anything that isn’t independently deployable. Move internals to Level 3. |
| Forgetting to show technology | Defeats the purpose of Level 2 | Add tech tags to every container. Use VP’s Technology property field. |
| Overloading with too many containers | Creates visual noise & maintenance burden | Cap at 7±2. Group related services logically or split into sub-diagrams. |
| Unclear or missing relationships | Arrows labeled uses or connects to |
Use verb + noun + protocol. Example: Syncs user profiles (gRPC) |
Last Updated: YYYY-MM-DD in the footer.Share Diagram link for live collaboration. Embed in Confluence, GitHub READMEs, or onboarding wikis. Schedule quarterly architecture reviews.The Container Diagram is where architecture becomes actionable. It gives developers a clear map of what runs where, how data moves, and what tech choices were made. By mastering this level, you prevent integration surprises, accelerate onboarding, and create a living blueprint that evolves with your system.
Your action plan: Pick one active service or feature. Open Visual Paradigm. Draft a Container Diagram using the 5-step guide. Share it with one developer and one stakeholder. Iterate based on feedback. Do this within 7 days.
data/action + protocolReact, PostgreSQL, Kafka).C4 Model > Container DiagramC4 Default or C4 Light (consistent coloring, auto-styling)Hierarchical > Left-to-Right for clean flowTechnology, Description, Responsibility fieldsPNG/PDF > Include Legend > 300 DPI for documentationFile > Properties > Version Notes + footer timestamp for audit trails