When beginners start documenting software architecture, they often jump straight into databases, microservices, or class structures. The result? Stakeholders get lost, developers argue over implementation details, and the real business problem gets buried in technical noise.
The C4 Context Diagram fixes this by starting at the highest, most human-friendly level. It answers three simple questions before anyone writes a single line of code:
By starting here, teams align on scope, avoid scope creep, and create a shared language that both engineers and business stakeholders understand.
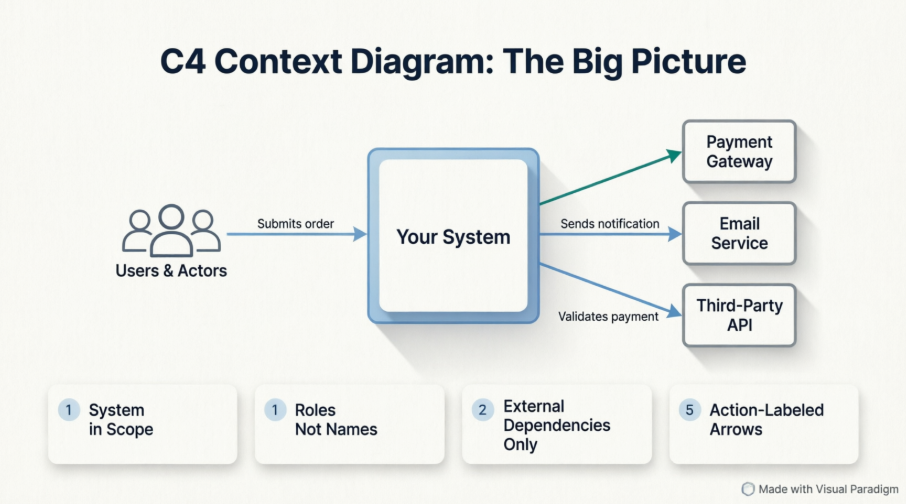
The C4 model is a layered approach to software architecture diagrams. The Context Diagram is Level 1: the “Big Picture” view.
What it shows:
What it deliberately hides:
Who should read and use it:
Product managers, stakeholders, developers, QA, support teams, and anyone who needs to understand the system’s boundaries without getting lost in implementation details.
| Element | Visual Representation | Purpose |
|---|---|---|
| System (in scope) | Solid rectangle, centered | The software you are designing or documenting |
| Users & Actors | Person icon or labeled box | Humans or roles interacting with the system |
| External Systems | Dashed or differently colored rectangle | Third-party APIs, legacy systems, payment gateways, etc. |
| Relationships | Directed arrows with labels | What is exchanged (data, commands, triggers) and optionally the protocol |
Simple rules to keep it clean and correct:
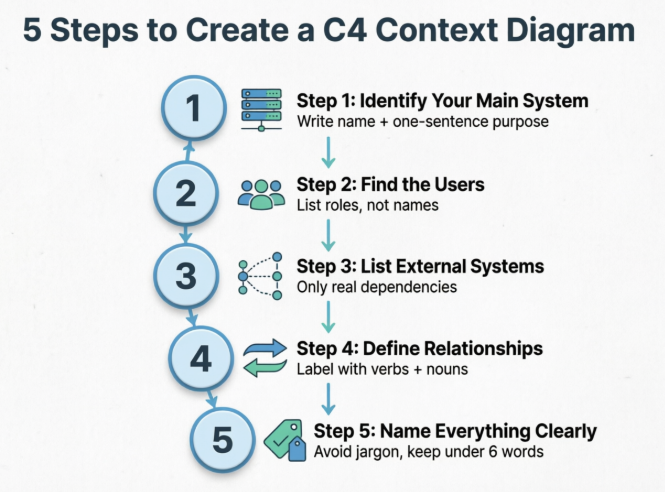
Step 1: Identify your main system
Write down the exact name and one-sentence purpose. Example: Order Management System – Tracks, routes, and fulfills customer orders.
Step 2: Find the users
List roles, not names. Example: Customer, Warehouse Staff, Finance Auditor, Support Agent.
Step 3: List external systems
Only include systems your software actually communicates with. Example: Stripe, SAP ERP, Twilio, SSO Provider.
Step 4: Define the relationships
Draw lines between actors/systems. Label them with verbs + nouns. Example: Submits order →, Validates payment →, Syncs inventory ←.
Step 5: Name everything clearly (best naming tips)
Processes Payments, Notifies Customer, Syncs InventoryCalls REST /api/v2/pay with Sends payment detailsQuick checklist before you finish:
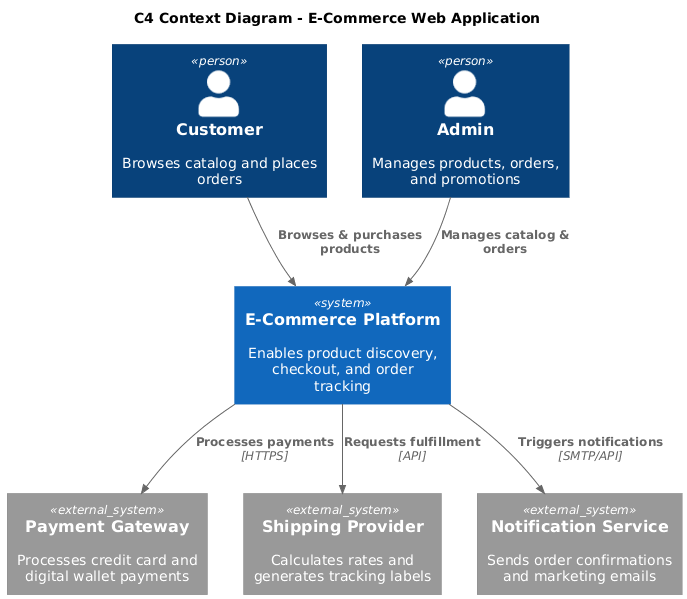
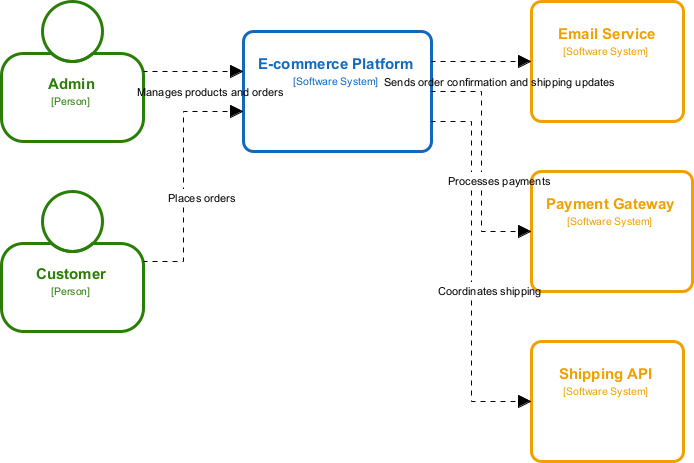
A standard storefront with customers, admins, payment, shipping, and email services.
@startuml
!include https://raw.githubusercontent.com/plantuml-stdlib/C4-PlantUML/master/C4_Context.puml

title C4 Context Diagram - E-Commerce Web Application

Person(customer, "Customer", "Browses catalog and places orders")
Person(admin, "Admin", "Manages products, orders, and promotions")

System(shop, "E-Commerce Platform", "Enables product discovery, checkout, and order tracking")

System_Ext(payment, "Payment Gateway", "Processes credit card and digital wallet payments")
System_Ext(shipping, "Shipping Provider", "Calculates rates and generates tracking labels")
System_Ext(email, "Notification Service", "Sends order confirmations and marketing emails")

Rel(customer, shop, "Browses & purchases products")
Rel(admin, shop, "Manages catalog & orders")
Rel(shop, payment, "Processes payments", "HTTPS")
Rel(shop, shipping, "Requests fulfillment", "API")
Rel(shop, email, "Triggers notifications", "SMTP/API")

@enduml
@startuml
!include https://raw.githubusercontent.com/plantuml-stdlib/C4-PlantUML/master/C4_Context.puml
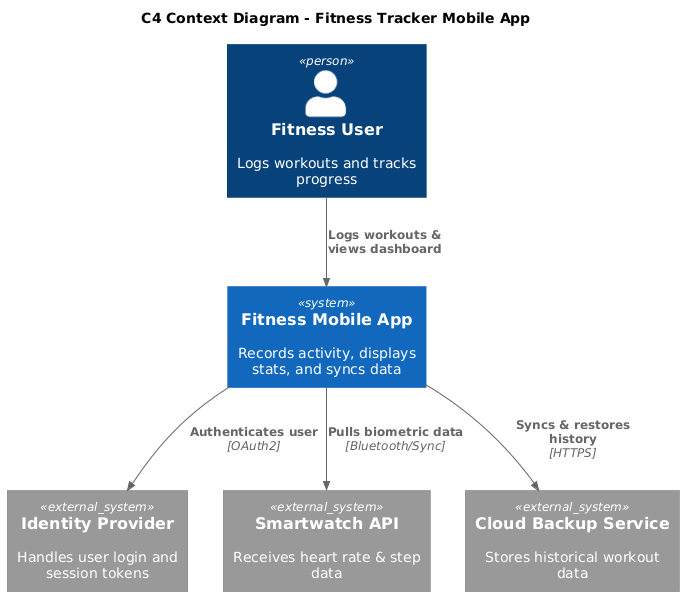
title C4 Context Diagram - Fitness Tracker Mobile App
Person(user, "Fitness User", "Logs workouts and tracks progress")
System(app, "Fitness Mobile App", "Records activity, displays stats, and syncs data")
System_Ext(auth, "Identity Provider", "Handles user login and session tokens")
System_Ext(wearables, "Smartwatch API", "Receives heart rate & step data")
System_Ext(cloud, "Cloud Backup Service", "Stores historical workout data")
Rel(user, app, "Logs workouts & views dashboard")
Rel(app, auth, "Authenticates user", "OAuth2")
Rel(app, wearables, "Pulls biometric data", "Bluetooth/Sync")
Rel(app, cloud, "Syncs & restores history", "HTTPS")
@enduml
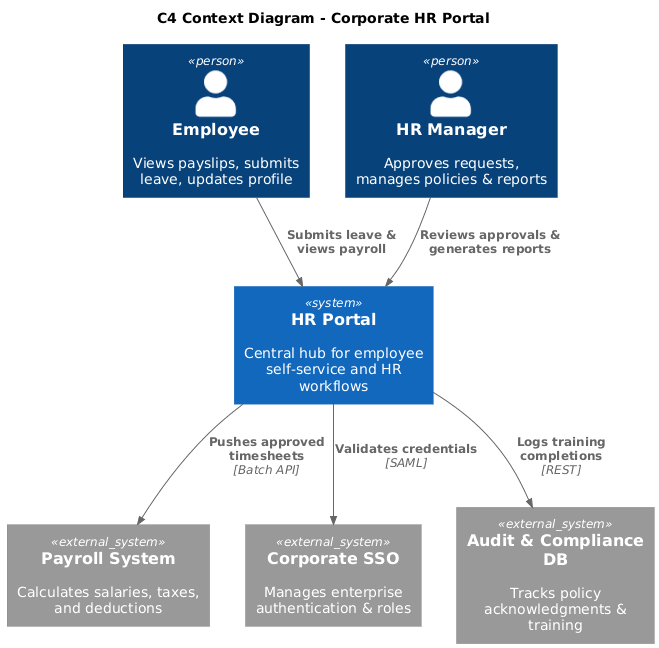
A corporate HR portal integrating with payroll, compliance, and internal directories.
@startuml
!include https://raw.githubusercontent.com/plantuml-stdlib/C4-PlantUML/master/C4_Context.puml

title C4 Context Diagram - Corporate HR Portal

Person(employee, "Employee", "Views payslips, submits leave, updates profile")
Person(hr_manager, "HR Manager", "Approves requests, manages policies & reports")

System(hr_portal, "HR Portal", "Central hub for employee self-service and HR workflows")

System_Ext(payroll, "Payroll System", "Calculates salaries, taxes, and deductions")
System_Ext(sso, "Corporate SSO", "Manages enterprise authentication & roles")
System_Ext(compliance, "Audit & Compliance DB", "Tracks policy acknowledgments & training")

Rel(employee, hr_portal, "Submits leave & views payroll")
Rel(hr_manager, hr_portal, "Reviews approvals & generates reports")
Rel(hr_portal, payroll, "Pushes approved timesheets", "Batch API")
Rel(hr_portal, sso, "Validates credentials", "SAML")
Rel(hr_portal, compliance, "Logs training completions", "REST")

@enduml
Bad: Shows databases, load balancers, microservice names, protocol ports, and mixes internal/external boundaries.
Good: One central system, clear actors, 3–5 external dependencies, action-labeled arrows, zero implementation details.
Sends invoice data beats POST /api/v3/invoices.Finance Services instead of listing 5 separate billing APIs).Why Visual Paradigm is beginner-friendly:
Traditional way: Step-by-step using Visual Paradigm (manual drawing)
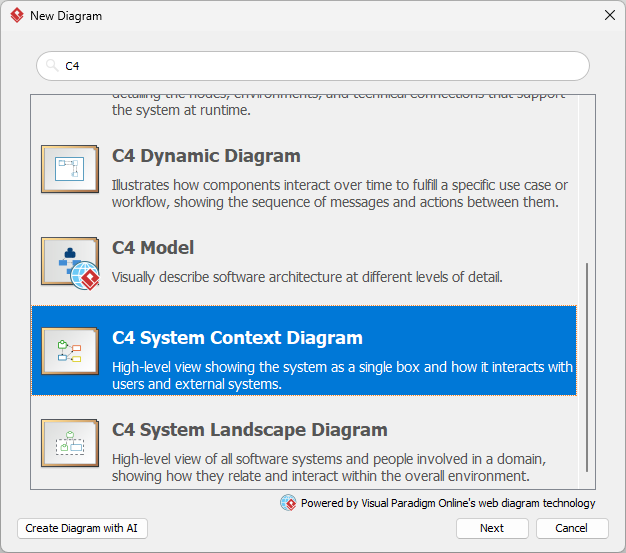
Person shapes for actors, System for your main software, System_Ext for third parties.
Relationship connector to draw arrows. Double-click lines to add labels.
Open Specification → Edit names and descriptions.Auto Layout or Align/Distribute tools to clean up spacing.Modern way: Using Visual Paradigm’s AI-Powered Features
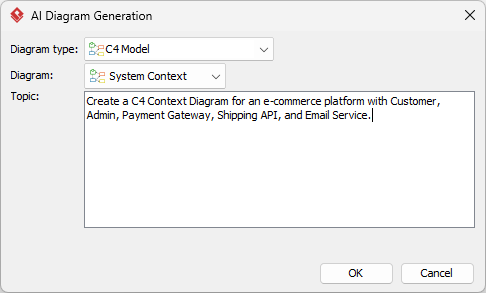
Create a C4 Context Diagram for an e-commerce platform with Customer, Admin, Payment Gateway, Shipping API, and Email Service.
Comparison: Traditional vs AI-Assisted Approach
| Aspect | Traditional Manual | AI-Assisted |
|---|---|---|
| Speed | 15–30 mins | 30–60 secs |
| Learning curve | Teaches structure deeply | Fast start, requires review |
| Accuracy | High if you know C4 rules | Good, but always verify labels & scope |
| Best for | Complex legacy systems, strict governance | Rapid prototyping, team onboarding |
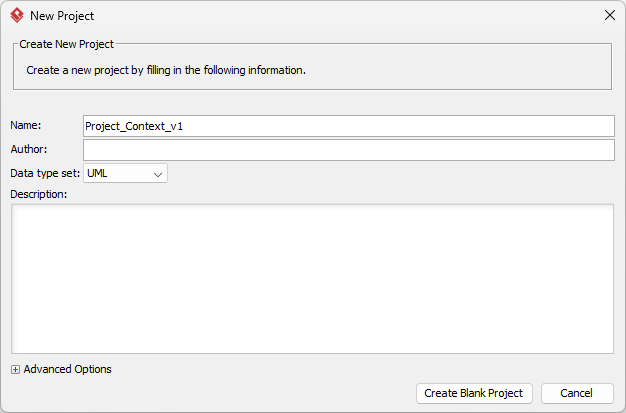
Setting up your project
Project_Context_v1. Click Create Blank Project to confirm.
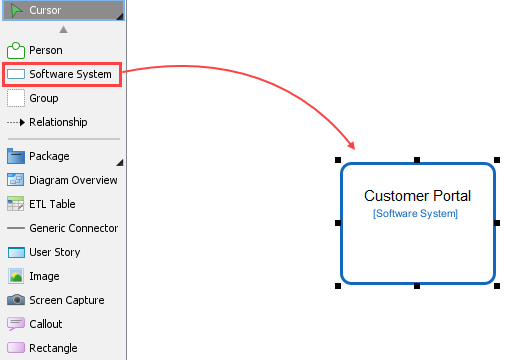
Traditional method walkthrough (screenshot-style guide)
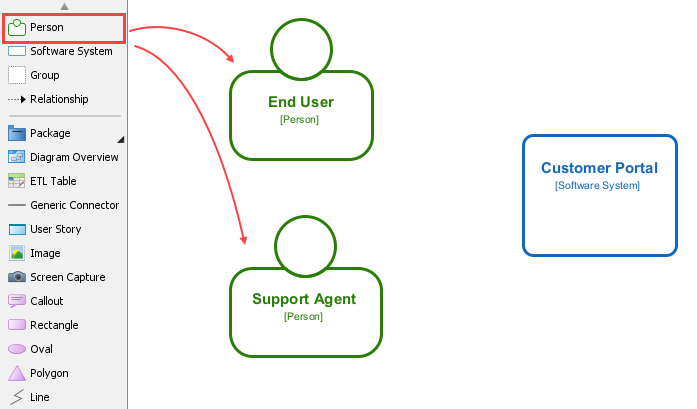
Software System to the center. Rename it Customer Portal.
Person shapes left. Name them End User, Support Agent.
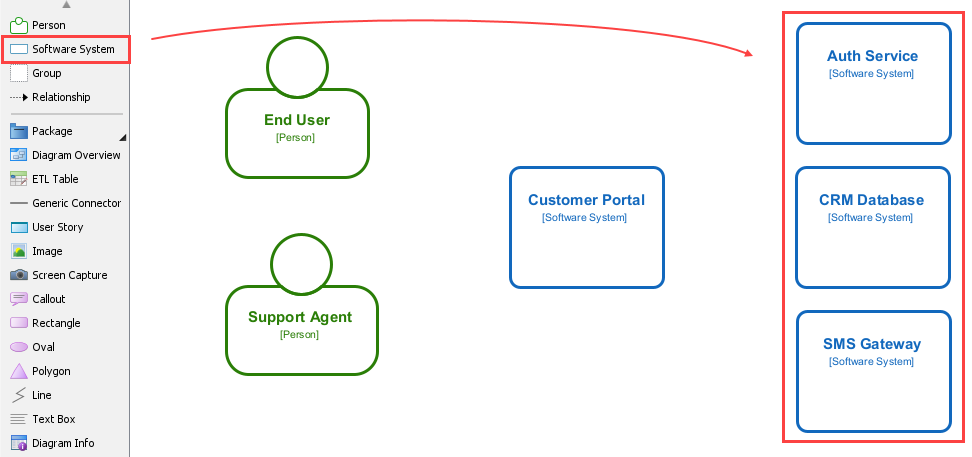
Software System shapes right. Name them Auth Service, CRM Database, SMS Gateway.
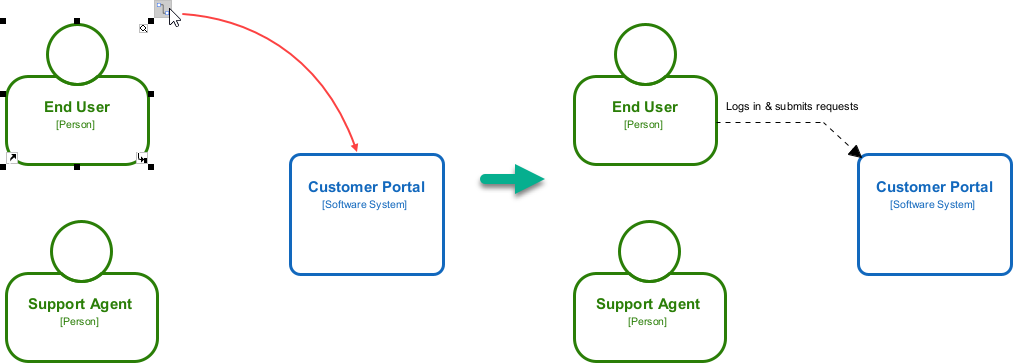
Relationship tool. Click End User → drag to Customer Portal → label Logs in & submits requests.
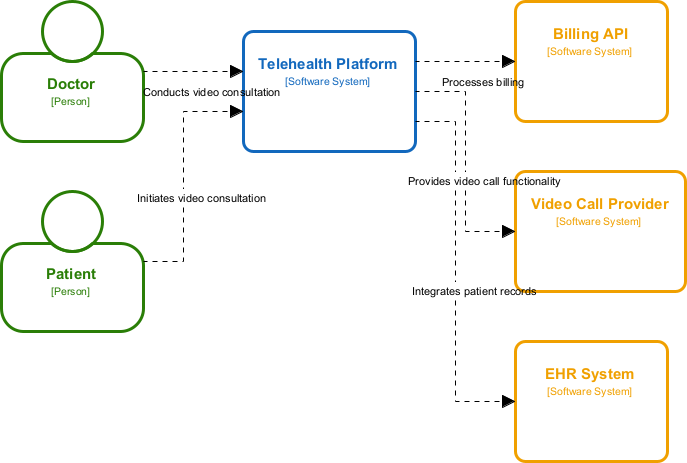
Using AI to generate your first Context Diagram automatically
Draw a C4 Context Diagram for a telehealth app. Actors: Patient, Doctor. System: Telehealth Platform. External: Video Call Provider, EHR System, Billing API.
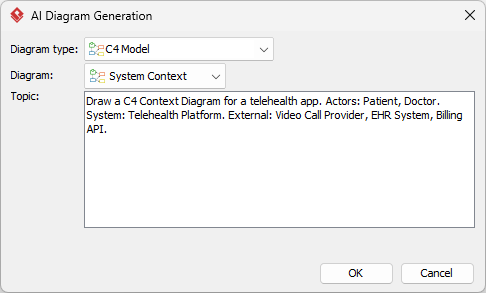
OK. VP places shapes, connects them, and adds default labels.
Editing and improving AI-generated diagrams
Open Specification panel for each shape (useful for stakeholder handoff).| Mistake | Why it’s wrong | How to fix it |
|---|---|---|
| Mixing levels of detail | Shows databases, queues, or microservices in a context diagram | Delete internal elements. Keep only systems that exist outside your boundary. |
| Too many boxes/unclear relationships | Creates cognitive overload; arrows become spaghetti | Group related externals into logical domains. Use 1 relationship per interaction. |
| Technical jargon in names | POST /auth/token, gRPC channel, Kafka topic |
Translate to business intent: Validates user identity, Sends events |
| No versioning or review process | Diagrams become outdated quickly | Add `v1.0 |
How to review: Print it or share a VP link. Ask a non-technical teammate: “Can you explain what this system does in one sentence?” If they can’t, simplify.
Share Diagram link for live viewing. Export to PDF for meetings. Embed in onboarding docs. Add a “Last Updated” stamp.The C4 Context Diagram isn’t about drawing pretty boxes. It’s about aligning minds before writing code. By starting at the boundary, you prevent miscommunication, reduce rework, and give every team member a shared mental model.
Your first action today: Pick one active project. Open Visual Paradigm. Draw one Context Diagram in under 20 minutes. Share it with one stakeholder. Ask for feedback. Iterate.
c4model.com (Simon Brown’s original specification)