In today's cloud-native landscape, infrastructure complexity evolves faster than traditional documentation practices can keep pace. Engineering teams frequently struggle with "documentation drift"—the growing gap between architectural diagrams and the live systems they represent. Manual diagramming tools, while intuitive, often become outdated the moment a new service is deployed or a network boundary shifts.
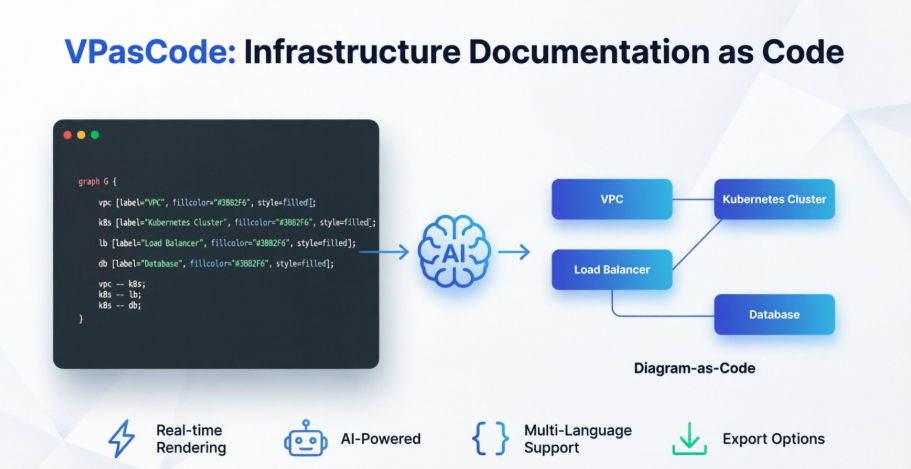
The solution lies in a paradigm shift: treating documentation with the same precision and automation as application development. By adopting Diagram-as-Code (DaC) principles, teams can embed architecture visualization directly into their engineering workflows—enabling real-time rendering, AI-assisted authoring, and continuous alignment with production environments.
This case study explores how a forward-thinking DevOps team leveraged VPasCode—Visual Paradigm's browser-based Diagram-as-Code environment—alongside the Graphviz DOT language to modernize their infrastructure documentation. The result: a living, accurate, and collaborative visual representation of their enterprise cloud architecture that stays synchronized with their systems through automation and intelligent tooling.
As the organization expanded its multi-cloud footprint, the infrastructure team faced mounting pressure to maintain clear, accurate architectural documentation. Traditional tools like Visio or Lucidchart required manual updates, leading to:
The team needed a solution that would make documentation a natural extension of their engineering practices—not a separate, burdensome task.
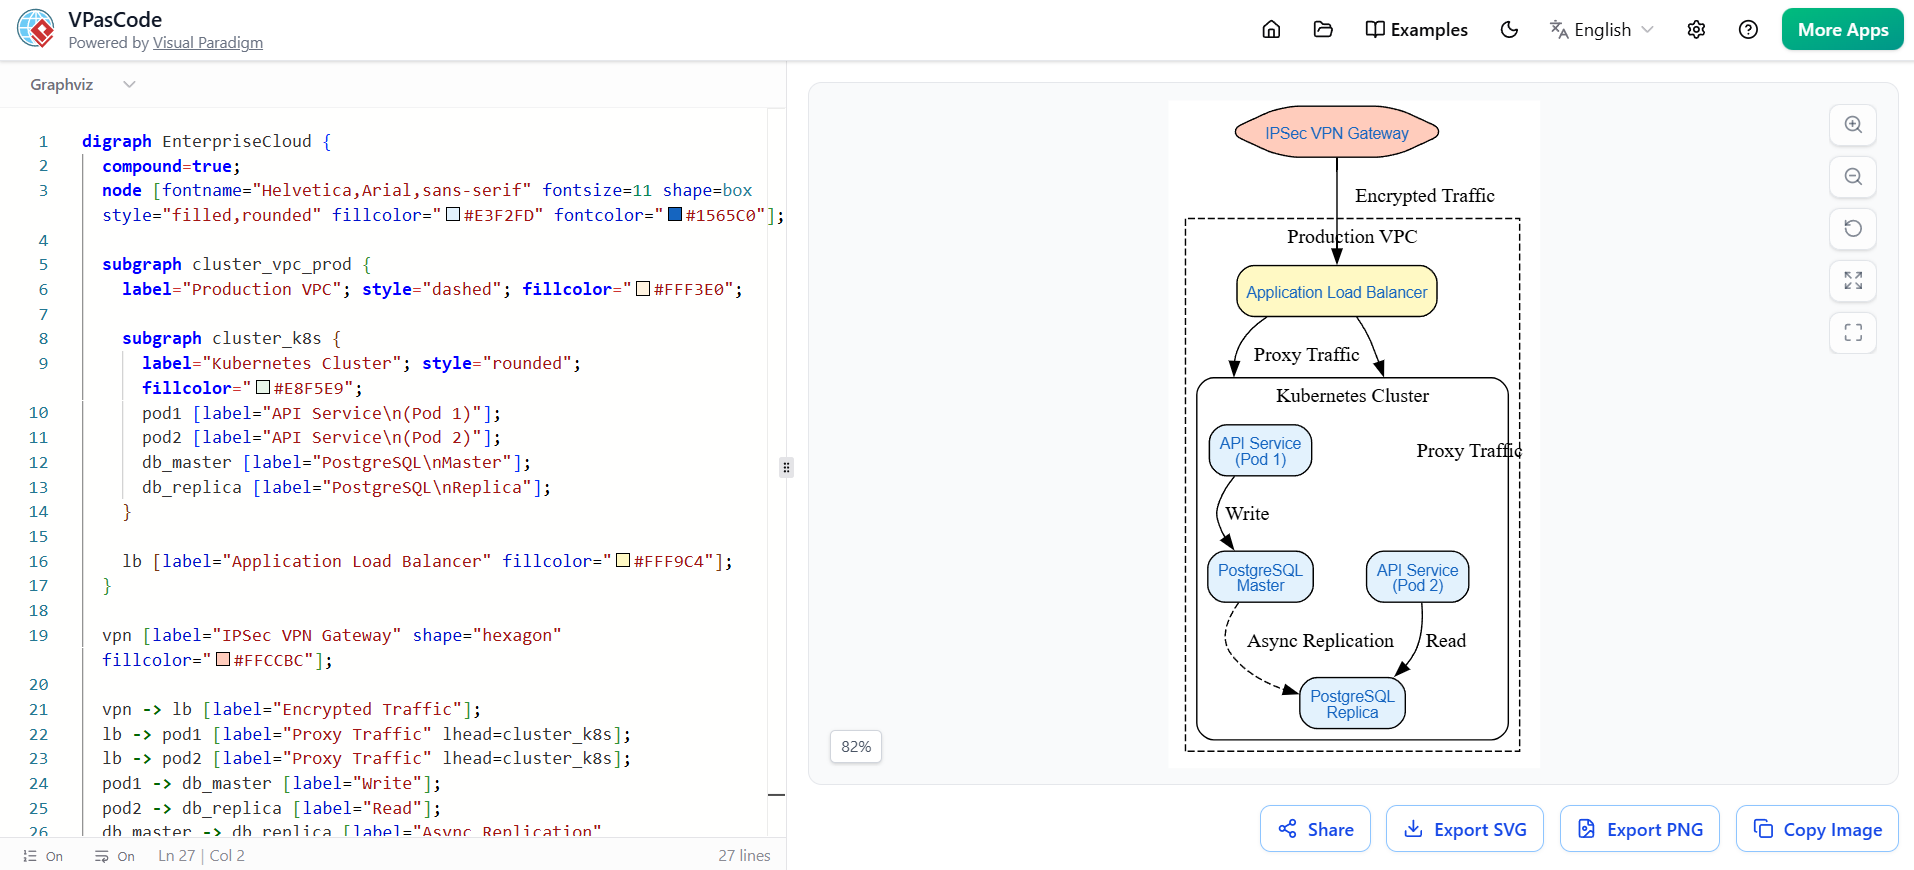
The team adopted VPasCode as their central Diagram-as-Code platform, using the Graphviz DOT language to define their cloud architecture programmatically. By writing infrastructure diagrams as text files, they unlocked powerful new capabilities:
digraph EnterpriseCloud {
  compound=true;
  node [fontname="Helvetica,Arial,sans-serif" fontsize=11 shape=box style="filled,rounded" fillcolor="#E3F2FD" fontcolor="#1565C0"];

  subgraph cluster_vpc_prod {
    label="Production VPC"; style="dashed"; fillcolor="#FFF3E0";

    subgraph cluster_k8s {
      label="Kubernetes Cluster"; style="rounded"; fillcolor="#E8F5E9";
      pod1 [label="API Service\n(Pod 1)"];
      pod2 [label="API Service\n(Pod 2)"];
      db_master [label="PostgreSQL\nMaster"];
      db_replica [label="PostgreSQL\nReplica"];
    }

    lb [label="Application Load Balancer" fillcolor="#FFF9C4"];
  }

  vpn [label="IPSec VPN Gateway" shape="hexagon" fillcolor="#FFCCBC"];

  vpn -> lb [label="Encrypted Traffic"];
  lb -> pod1 [label="Proxy Traffic" lhead=cluster_k8s];
  lb -> pod2 [label="Proxy Traffic" lhead=cluster_k8s];
  pod1 -> db_master [label="Write"];
  pod2 -> db_replica [label="Read"];
  db_master -> db_replica [label="Async Replication" style="dashed"];
}
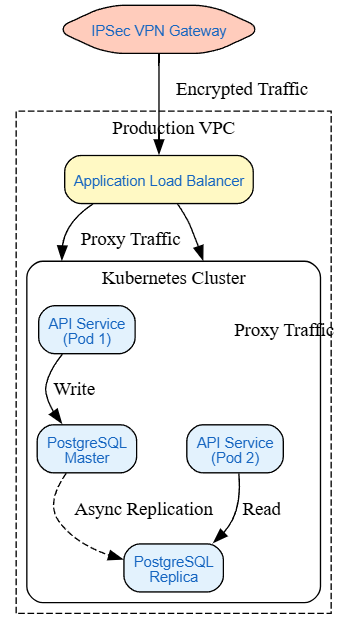
The team used DOT's subgraph cluster_* syntax to model hierarchical cloud boundaries—VPCs, subnets, and Kubernetes namespaces—creating visual containment that mirrored their actual infrastructure topology. This made complex network relationships immediately comprehensible.
By defining node and edge styles at the graph level, the team ensured visual consistency across all diagrams. Attributes like shape, fillcolor, and style were centralized, reducing cognitive load and maintaining brand-aligned documentation.
Every connection between services was declared as an edge with descriptive labels (lb -> pod1 [label="Proxy Traffic"]). This transformed abstract architecture into an actionable map of data flow, security boundaries, and dependency chains.
Using compound=true and lhead/ltail attributes, the team directed edges to cluster boundaries rather than individual nodes—accurately representing traffic entering a Kubernetes cluster or VPC without implying a specific pod-level destination.
The true power emerged when the team embedded this approach into their daily workflow:
| Stage | Traditional Approach | Diagram-as-Code Approach |
|---|---|---|
| Authoring | Drag-and-drop in GUI editor | Write/edit DOT code in IDE or VPasCode |
| Collaboration | Email PDFs or share static links | Share live, interactive diagram links |
| Generation | Manual export and upload | Auto-rendered on save or trigger |
| Consumption | Static image in wiki | Live, searchable, always-current documentation |
VPasCode serves as the central hub for this workflow—a browser-based, zero-install environment where engineers write, preview, and share diagrams using industry-standard syntax.
Multi-Language Support
Write diagrams in PlantUML for UML/C4 models, Mermaid for flowcharts and timelines, or Graphviz/DOT for complex network topologies—all rendered instantly in the same interface.
Real-Time Preview
As you type, the right panel updates with a high-fidelity vector rendering. No export steps, no waiting—just immediate visual feedback.
AI-Powered Assistance
Integrated AI tools help generate valid diagram syntax from natural language prompts. Describe your architecture ("a microservice calling a database behind an API gateway"), and VPasCode scaffolds the corresponding code.
Seamless Export & Integration
Export diagrams as SVG, PNG, or PDF with one click. Share via persistent links, embed in Markdown documentation, or push directly into Visual Paradigm's broader modeling suite for advanced refinement.
Git-Native Friendly Authoring
Diagram source files can be stored alongside application code, allowing teams to maintain a single source of truth for both infrastructure logic and its visual representation.
[Natural Language Prompt]
        ↓
[AI Chatbot generates PlantUML/DOT script]
        ↓
[VPasCode Live Playground Renders Graph]
        ↓
[SVG/PNG Export] ←→ [Import to Visual Paradigm Online]
This streamlined flow turns architectural thinking into visual documentation in minutes—not hours.
Treating infrastructure documentation as code isn't just a technical upgrade—it's a cultural shift that aligns visualization with engineering precision. By adopting VPasCode and the Graphviz DOT language, the team transformed their architecture diagrams from static, error-prone artifacts into dynamic, auto-generated assets that stay synchronized with their systems.
The benefits extend far beyond accurate visuals. This approach fosters clearer communication across engineering, security, and leadership teams; reduces the cognitive load of onboarding; and embeds architectural thinking directly into the development lifecycle. Most importantly, it frees engineers to spend less time maintaining diagrams and more time building resilient, secure systems.
As cloud architectures continue to grow in complexity, the organizations that thrive will be those that make documentation a first-class citizen of their engineering practice. With tools like VPasCode, the path from code to clarity has never been shorter—or more powerful.
Key Takeaway: When your documentation is generated from code, rendered in real-time, and enhanced by AI, you don't just avoid drift—you turn architecture visualization into a seamless, always-current asset that accelerates every stage of development.