
In the complex landscape of information systems, data is only as valuable as its organization. Before a single line of SQL is written or a database table is created, architects and developers need a clear blueprint to visualize how business concepts connect. Enter the Entity-Relationship Diagram (ERD). More than just a technical drawing, an ERD is a foundational data modeling technique that translates abstract business processes into a structured visual language. Whether you are defining requirements for a new sales platform, debugging a legacy system, or re-engineering a workflow, understanding ERDs provides the critical starting point for building robust, scalable relational databases. This guide explores the core components, cardinalities, and modeling levels necessary to master this essential tool.
An Entity-Relationship Diagram (ERD), also known as an entity relationship model, is a graphical representation of an information system. It depicts the relationships among people, objects, places, concepts, or events within that system.
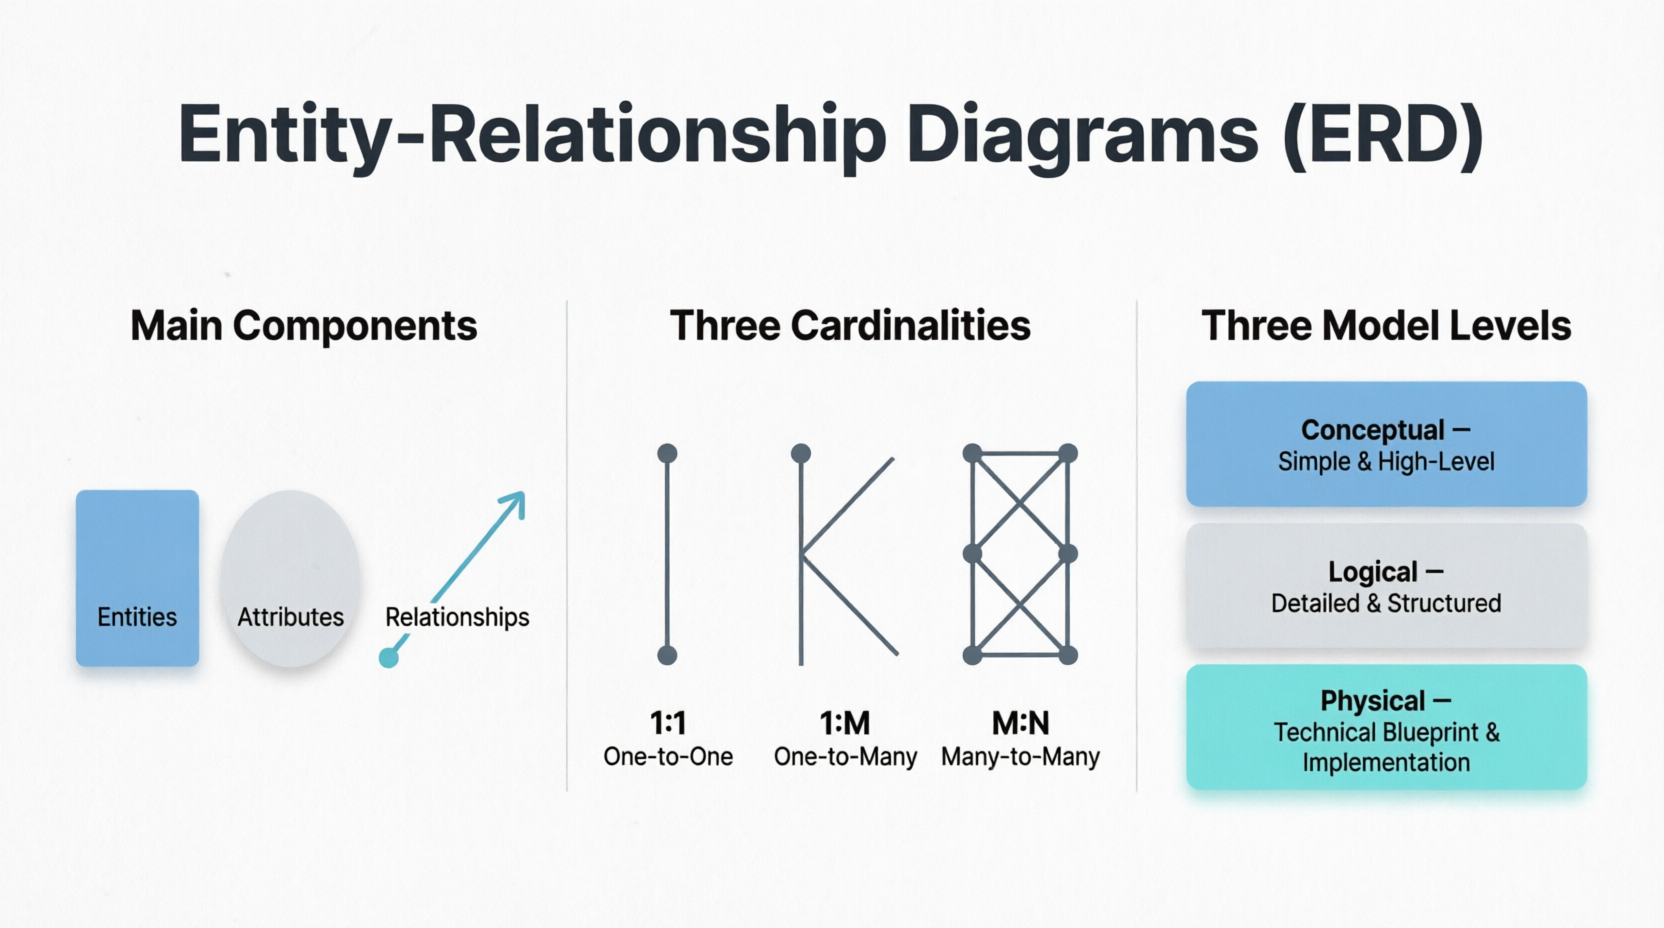
ERDs are critical throughout the lifecycle of an information system:
Limitations to Note:
ERDs are generally depicted at three levels of detail, progressing from abstract to concrete:
There are three basic components you must identify when building an ERD:
Entities are objects or concepts about which data can be stored. They are typically represented as rectangles in diagrams.
Customer, Product, Order, Sales Representative, Warehouse.Attributes are properties or characteristics of entities. They are typically listed inside the entity rectangle or connected via ovals.
Customer_ID).These are the connections between entities, represented by lines or symbols. Text labels are often used to describe the nature of the relationship (e.g., "places," "contains," "works for").
Cardinality defines the numerical relationship between entities. It answers the question: "How many instances of Entity A can relate to how many instances of Entity B?"
The three main cardinalities are:
Customer has exactly one Mailing Address.Customer can place multiple Orders. However, each specific Order belongs to only one Customer.Call Center Agents and Customers. One agent helps many customers, and one customer may be helped by many different agents over time.Diagram as Code (DaC) is a methodology that treats diagram creation and maintenance as a software development process, where visualizations are defined using text-based markup languages or domain-specific scripts rather than manual drag-and-drop tools. Instead of relying on proprietary binary files or static images, DaC allows users to write code—such as PlantUML, Mermaid.js, Graphviz DOT, or Structurizr—that is then automatically compiled into rendered diagrams.
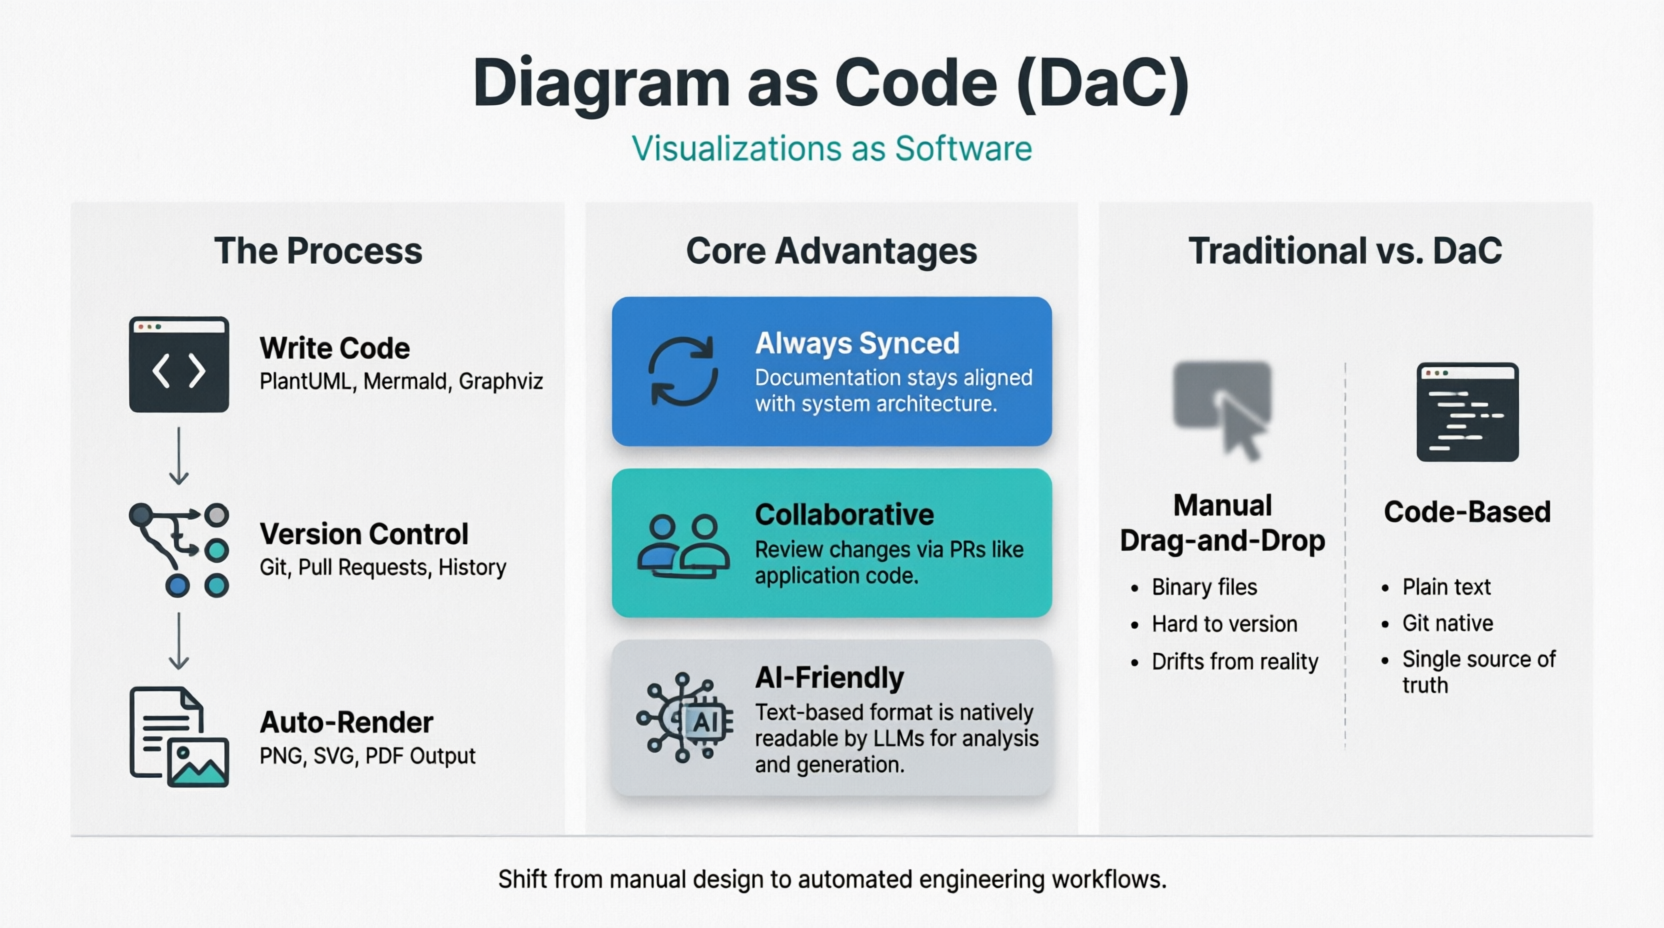
This approach integrates seamlessly into version control systems like Git, enabling teams to track changes, review updates via pull requests, and maintain a single source of truth alongside their application code. By shifting diagramming from a manual design task to an automated engineering workflow, Diagram as Code ensures that documentation remains synchronized with system architecture, reduces the friction of updating visuals, and supports reproducible, collaborative infrastructure and data modeling practices.
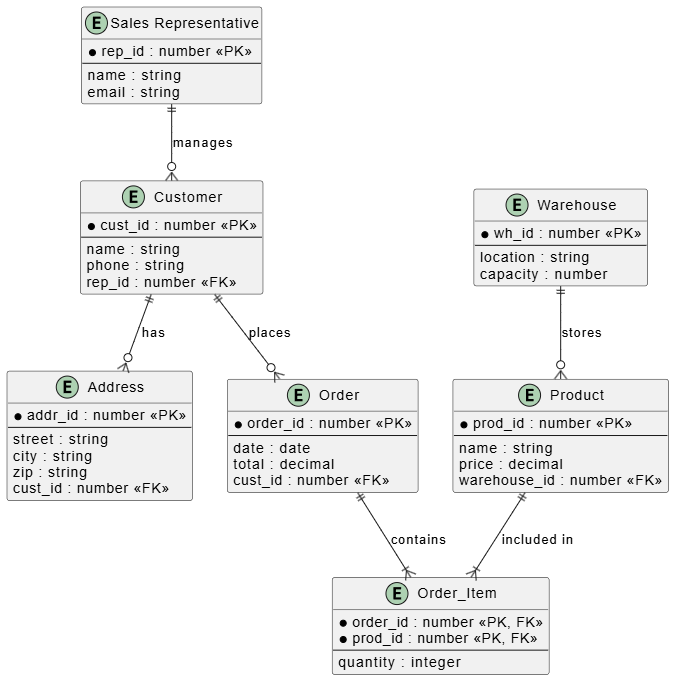
Below are examples of how to represent these concepts using PlantUML, a popular tool for creating UML and ER diagrams using code.
This example reflects the scenario mentioned in the text: Sales Reps, Customers, Addresses, Orders, Products, and Warehouses.
Key Relationships:
@startuml
' Define Entities
entity "Sales Representative" as SR {
    * rep_id : number <<PK>>
    --
    name : string
    email : string
}

entity "Customer" as C {
    * cust_id : number <<PK>>
    --
    name : string
    phone : string
    rep_id : number <<FK>>
}

entity "Address" as A {
    * addr_id : number <<PK>>
    --
    street : string
    city : string
    zip : string
    cust_id : number <<FK>>
}

entity "Order" as O {
    * order_id : number <<PK>>
    --
    date : date
    total : decimal
    cust_id : number <<FK>>
}

entity "Product" as P {
    * prod_id : number <<PK>>
    --
    name : string
    price : decimal
    warehouse_id : number <<FK>>
}

entity "Warehouse" as W {
    * wh_id : number <<PK>>
    --
    location : string
    capacity : number
}

' Junction Table for Many-to-Many between Order and Product
entity "Order_Item" as OI {
    * order_id : number <<PK, FK>>
    * prod_id : number <<PK, FK>>
    --
    quantity : integer
}

' Define Relationships
SR ||--o{ C : "manages"
C ||--o{ O : "places"
C ||--o{ A : "has"
O ||--|{ OI : "contains"
P ||--|{ OI : "included in"
W ||--o{ P : "stores"

@enduml
Looking for a powerful, free diagram-as-code tool? Effortlessly render PlantUML, Mermaid, Graphviz, and 20+ programming languages in real time—powered by instant AI error fixing and automatic format detection.
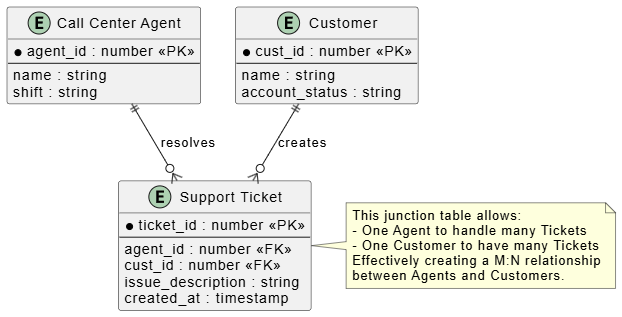
The text specifically mentions the M:N relationship between Call Center Agents and Customers. In a physical model, this requires a junction table (e.g., Interaction_Log).
@startuml
entity "Call Center Agent" as Agent {
    * agent_id : number <<PK>>
    --
    name : string
    shift : string
}

entity "Customer" as Cust {
    * cust_id : number <<PK>>
    --
    name : string
    account_status : string
}

' Junction Table to resolve M:N
entity "Support Ticket" as Ticket {
    * ticket_id : number <<PK>>
    --
    agent_id : number <<FK>>
    cust_id : number <<FK>>
    issue_description : string
    created_at : timestamp
}

' Relationships
Agent ||--o{ Ticket : "resolves"
Cust ||--o{ Ticket : "creates"

note right of Ticket
  This junction table allows:
  - One Agent to handle many Tickets
  - One Customer to have many Tickets
  Effectively creating a M:N relationship
  between Agents and Customers.
end note

@enduml
As mentioned in the text, a customer might have exactly one mailing address associated with their profile in a simplified view.
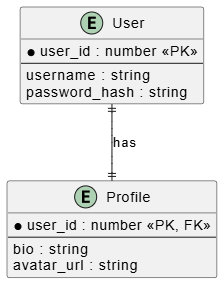
@startuml
entity "User" as U {
    * user_id : number <<PK>>
    --
    username : string
    password_hash : string
}

entity "Profile" as P {
    * user_id : number <<PK, FK>>
    --
    bio : string
    avatar_url : string
}

' One-to-One Relationship
U ||--|| P : "has"

@enduml
As data modeling evolves, the practice of defining Entity-Relationship Diagrams using code—often referred to as "Diagrams as Code" or specifically ERD-as-Code (using tools like PlantUML, Mermaid.js, or DBML)—is transforming how teams design and maintain databases. Unlike traditional drag-and-drop GUI tools that produce static image files, ERD-as-Code treats your database schema as a version-controlled text artifact. This shift offers profound benefits for engineering teams and creates a natural synergy with modern Artificial Intelligence workflows.
.puml, .mmd), they can be committed to Git repositories alongside application code. This allows teams to track exactly when and why a relationship changed, review schema modifications via Pull Requests, and roll back to previous versions if a design decision proves faulty.The intersection of ERD-as-Code and AI is particularly powerful because Large Language Models (LLMs) excel at processing structured text and code, but struggle with interpreting pixel-based images.
By adopting ERD-as-Code, organizations not only streamline their database engineering practices but also unlock the full potential of AI assistants to act as intelligent partners in data architecture, design validation, and system documentation.
Customer not Customers). Use verbs for relationships (e.g., places, owns, contains).o{ in PlantUML/Crow's Foot).|{ in PlantUML/Crow's Foot).Mastering Entity-Relationship Diagrams is a fundamental skill for anyone involved in data architecture or product development. By effectively utilizing the three main components—entities, attributes, and relationships—and correctly applying cardinality notations, teams can bridge the gap between high-level business concepts and physical database implementation. Remember that ERDs evolve through three distinct levels: from the broad scope of the Conceptual Model to the detailed rules of the Logical Model, and finally to the technical precision of the Physical Model. While it is important to recognize their limitations regarding unstructured data or pre-existing system integration, ERDs remain an indispensable asset. They serve not only as the blueprint for initial construction but also as a vital referral point for future maintenance, ensuring your information systems remain organized, efficient, and aligned with business needs.

