
An Entity Relationship Diagram (ERD or ER diagram) is a visual representation that illustrates how items in a database relate to each other. As a specialized type of flowchart, ERDs convey relationship types between different entities within a system using defined symbols such as rectangles, ovals, and diamonds connected by lines.
ERDs serve as high-level conceptual data models within the relational model of database design, establishing how entries in a database are connected. They set the foundation for more advanced database design and analysis while helping distill narratives and insights from seemingly disparate collections of data points.
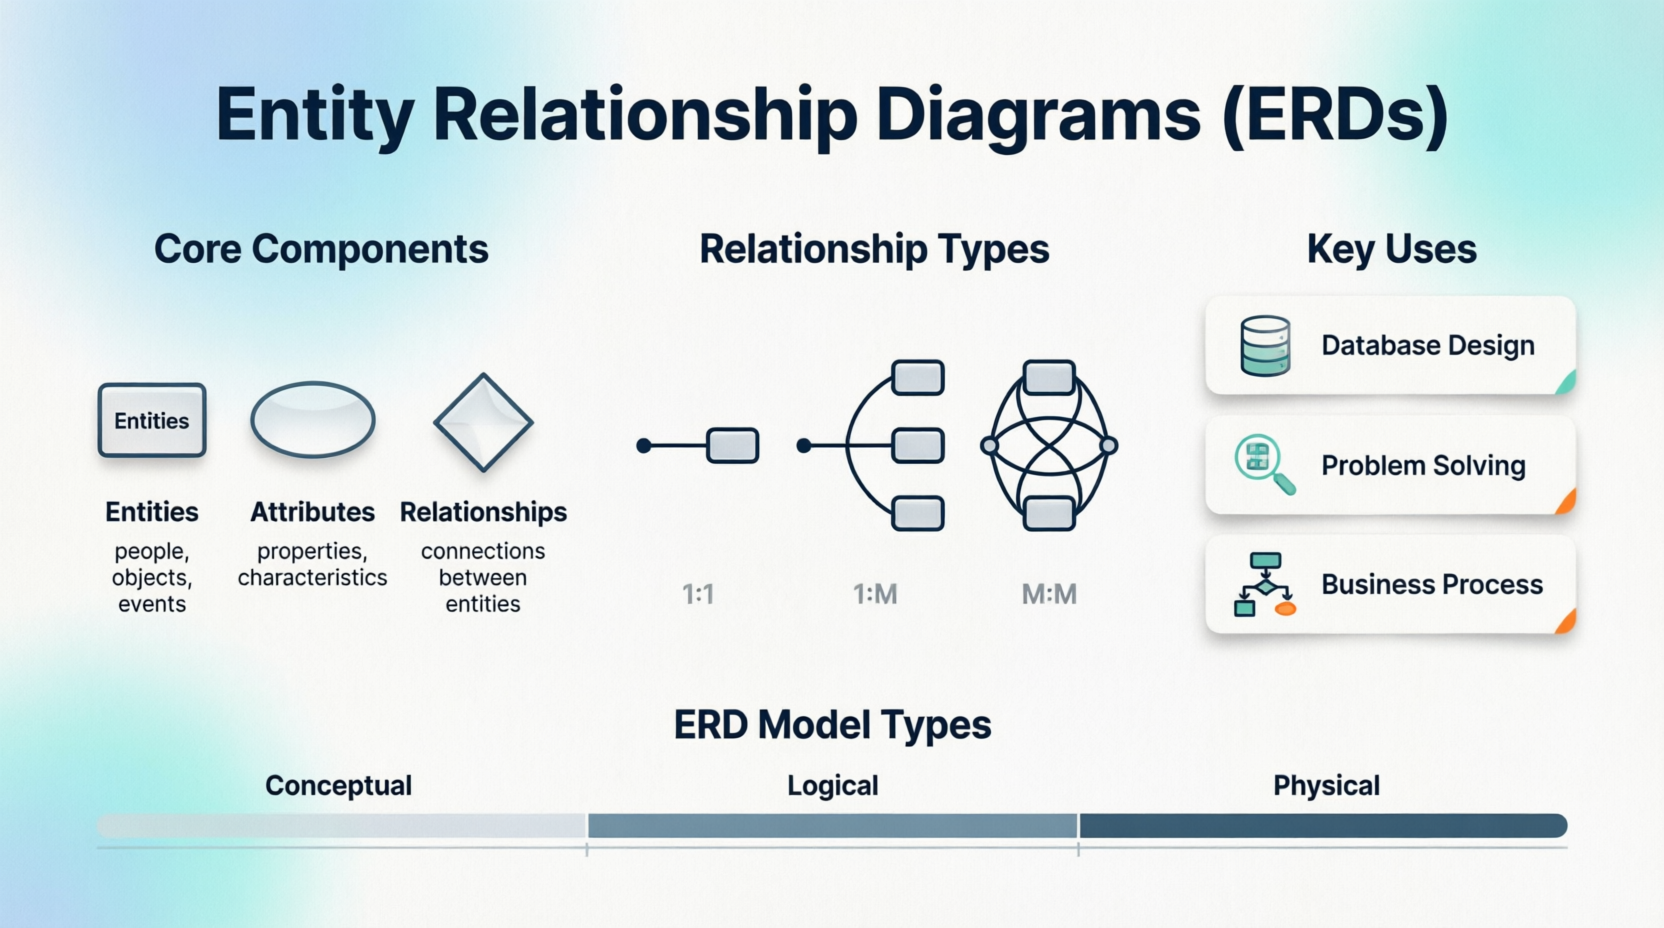
This guide provides a comprehensive overview of ERDs, including their uses, components, modeling approaches, styles, and practical implementation examples using PlantUML code.
Entities are definable things—people, roles, events, concepts, or objects—that can have information stored about them in a relational database.
Representation: Rectangles in most ERD styles
Examples:
People/Roles: Students, customers, executives
Events: Transactions, signups
Concepts: User profiles, personas
Objects: Products, invoices, emails
Entity Types:
Categories of entities (e.g., "vegetables" as a type containing instances like broccoli, carrot, asparagus)
Strong vs. Weak Entities:
Strong Entities: Contain sufficient identifying information independently (shown as solid rectangles)
Weak Entities: Exist only as outcomes of another entity; depend on a parent/owner entity (shown as double rectangles)
Example: In e-commerce, an order is a strong entity, but line items within that order are weak entities
Associative Entities:
Link instances between two entity sets with their own attributes
Represented as diamonds within rectangles
Inform junction tables in relational databases
Attributes are qualities, properties, and characteristics that define an entity.
Representation: Ovals displayed next to corresponding entities
Types of Attributes:
Simple Attributes: Cannot be split further (e.g., ZIP code)
Composite Attributes: Compiled from other attributes (e.g., address containing street, city, ZIP)
Derived Attributes: Calculated from other attributes (shown as dashed ovals; e.g., paycheck value)
Multivalue Attributes: Can have multiple values per record
Key Attributes:
Super Key: One or more attributes that uniquely define an entity
Candidate Key: Simplest possible super key
Primary Key: Chosen candidate key that uniquely defines an entity set (underlined in ERDs); no two entries share the same primary key
Foreign Key: Identifies one entity's relationship to another; weak entities rely on foreign keys
Relationships indicate how entities are associated with each other—the "verbs" connecting the "nouns."
Representation: Diamonds in traditional ERDs; weak relationships shown as double diamonds
Participation:
Total Participation: Entire entity set involved in the relationship
Partial Participation: Some or all entities involved at any specific time
Relationship Cardinality:
One-to-One (1:1): One record in one entity references only one record in another
Example: University ↔ President
One-to-Many (1:M): One record relates to multiple records in another entity
Example: University ↔ Departments
Many-to-Many (M:M): Multiple records in both entities can connect
Example: Students ↔ Professors
Business analysts and database engineers use ERDs to assess database scope and plan data storage
ERDs inform software engineering by laying out requirements for information systems architecture
In the three-schema approach, ERDs represent the conceptual tier
Help data engineers conceptualize overall systems and reduce errors during data integration
Comparing existing databases to ERDs reveals design missteps causing problems
Summarize complex databases so engineers can quickly identify potential errors without extensive SQL debugging
Provide bird's-eye views of all organizational data within information systems
Draft newer, more efficient data architecture solutions facilitating BPR stages
| Diagram Type | Purpose | Focus |
|---|---|---|
| Entity Relationship Diagrams | Illustrate entities and their relationships | Database structure and entity connections |
| Database Schemas | Establish rules for modeling real-world entities | Table names, fields, data types, organization guidelines |
| Data Flow Diagrams | Depict data movement through processes | How data flows from process to storage locations |
High-level view of data
Used by business analysts for large-scale projects (e.g., data warehouses)
Contains entities and relationships without detailed cardinality or table structures
Least detailed model
Similar to conceptual but with more detail
Defines columns/attributes within each entity
Includes operational and transactional entities
Used for smaller-scale database design projects
Concrete blueprints for database implementation
Maximum detail including cardinality, primary keys, and foreign keys
Created by database designers/engineers from conceptual and logical models
Most granular model
Introduced by Peter Chen in the 1970s
Uses various shapes connected by lines (similar to classical flowcharts)
Cardinality shown with characters: 1, M, N (where M and N represent "many")
Total participation: single connecting line; Partial participation: double connecting line
Named for three-pronged forked lines showing "many" relationships
Replaces Chen's symbols with tables representing entities
Each table contains all attributes
Clearly shows relationship cardinality
Charles Bachman's data structure diagrams inspired Chen
Uses lines with arrows to indicate cardinality
Introduced by US Air Force in the 1980s
Supports semantic data model development
Displays attributes within shared tables
Offers more cardinality options than Chen style
Created by Richard Barker in 1981
Standard for Oracle databases
Shares crow's foot style for connecting lines
Uses dashed lines for partial/optional participation
Below are practical ERD examples using PlantUML, a popular tool for creating diagrams from text descriptions.
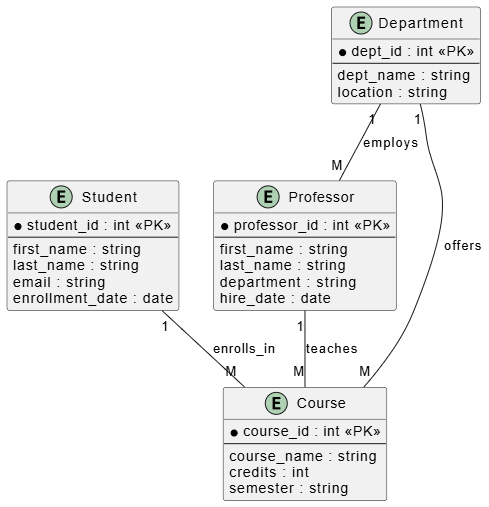
This example demonstrates a university system with students, professors, courses, and departments.
@startuml
skinparam rectangle {
    BackgroundColor White
    BorderColor Black
}

entity Student {
  * student_id : int <<PK>>
  --
  first_name : string
  last_name : string
  email : string
  enrollment_date : date
}

entity Professor {
  * professor_id : int <<PK>>
  --
  first_name : string
  last_name : string
  department : string
  hire_date : date
}

entity Course {
  * course_id : int <<PK>>
  --
  course_name : string
  credits : int
  semester : string
}

entity Department {
  * dept_id : int <<PK>>
  --
  dept_name : string
  location : string
}

' Relationships
Student "1" -- "M" Course : enrolls_in
Professor "1" -- "M" Course : teaches
Department "1" -- "M" Professor : employs
Department "1" -- "M" Course : offers

@enduml
Explanation:
Students enroll in many courses (M:M relationship would require an associative entity in physical model)
Professors teach multiple courses
Departments employ multiple professors and offer multiple courses
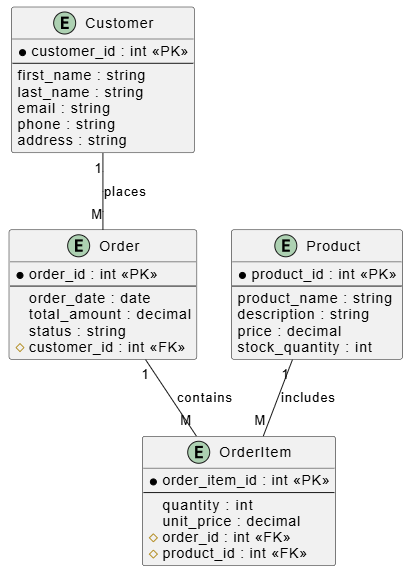
This example shows an e-commerce database with orders, products, and line items.
@startuml
skinparam rectangle {
    BackgroundColor White
    BorderColor Black
}

entity Customer {
  * customer_id : int <<PK>>
  --
  first_name : string
  last_name : string
  email : string
  phone : string
  address : string
}

entity Order {
  * order_id : int <<PK>>
  --
  order_date : date
  total_amount : decimal
  status : string
  # customer_id : int <<FK>>
}

entity Product {
  * product_id : int <<PK>>
  --
  product_name : string
  description : string
  price : decimal
  stock_quantity : int
}

entity OrderItem {
  * order_item_id : int <<PK>>
  --
  quantity : int
  unit_price : decimal
  # order_id : int <<FK>>
  # product_id : int <<FK>>
}

' Relationships
Customer "1" -- "M" Order : places
Order "1" -- "M" OrderItem : contains
Product "1" -- "M" OrderItem : includes

@enduml
Key Points:
Order is a strong entity with its own primary key
OrderItem is a weak entity dependent on Order (existence dependency)
OrderItem serves as an associative entity linking Orders and Products
Foreign keys (customer_id, order_id, product_id) establish relationships
@startuml
skinparam rectangle {
    BackgroundColor White
    BorderColor Black
}

entity Employee {
  * employee_id : int <<PK>>
  --
  first_name : string
  last_name : string
  email : string
  hire_date : date
  hourly_wage : decimal
}

entity Department {
  * dept_id : int <<PK>>
  --
  dept_name : string
  manager_id : int <<FK>>
}

entity Project {
  * project_id : int <<PK>>
  --
  project_name : string
  start_date : date
  end_date : date
  budget : decimal
}

entity Assignment {
  * assignment_id : int <<PK>>
  --
  hours_worked : int
  start_date : date
  end_date : date
  # employee_id : int <<FK>>
  # project_id : int <<FK>>
}

' Relationships
Department "1" -- "M" Employee : employs
Employee "M" -- "M" Project : works_on (through Assignment)
Employee "1" -- "1" Department : manages

note right of Employee
  Derived attribute example:
  Annual Salary = hourly_wage × 2080
end note

@enduml
Features Demonstrated:
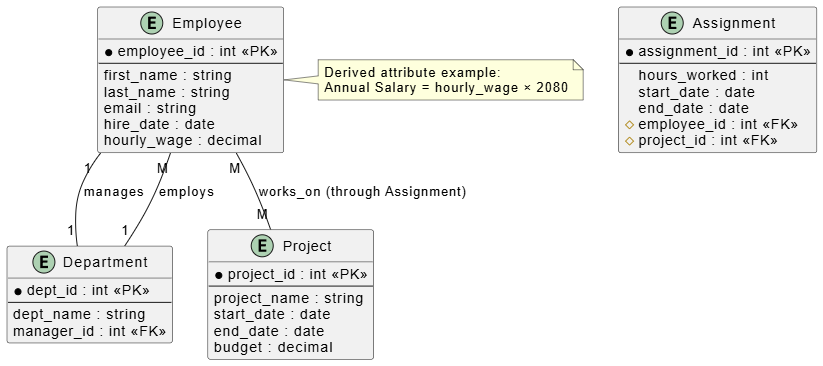
Many-to-many relationship between Employees and Projects resolved through associative entity Assignment
Note showing derived attribute calculation (annual salary from hourly wage)
Self-referencing relationship (manager within Department)
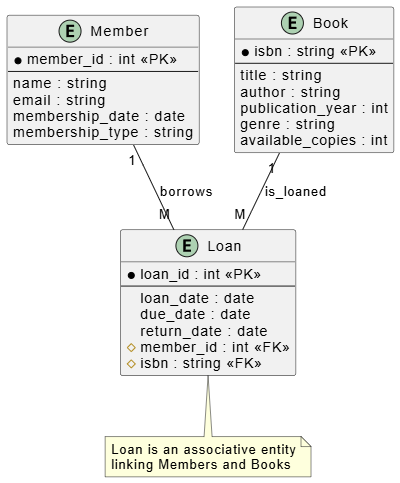
@startuml
skinparam rectangle {
    BackgroundColor White
    BorderColor Black
}

entity Member {
  * member_id : int <<PK>>
  --
  name : string
  email : string
  membership_date : date
  membership_type : string
}

entity Book {
  * isbn : string <<PK>>
  --
  title : string
  author : string
  publication_year : int
  genre : string
  available_copies : int
}

entity Loan {
  * loan_id : int <<PK>>
  --
  loan_date : date
  due_date : date
  return_date : date
  # member_id : int <<FK>>
  # isbn : string <<FK>>
}

' Relationships
Member "1" -- "M" Loan : borrows
Book "1" -- "M" Loan : is_loaned

note bottom of Loan
  Loan is an associative entity
  linking Members and Books
end note

@enduml
Start with Conceptual Models: Begin with high-level entities and relationships before adding attributes and cardinality details
Identify Strong vs. Weak Entities Early: Determine which entities can exist independently and which depend on others
Choose Appropriate Primary Keys: Select attributes that uniquely identify each entity instance; avoid using mutable data as primary keys
Resolve Many-to-Many Relationships: Use associative entities to break down M:M relationships into two 1:M relationships for physical implementation
Document Cardinality Clearly: Ensure relationship cardinality (1:1, 1:M, M:M) is explicitly shown using your chosen notation style
Consider Participation Constraints: Indicate whether entity participation in relationships is total or partial
Use Consistent Naming Conventions: Maintain consistent naming for entities, attributes, and relationships throughout the diagram
Validate with Stakeholders: Review ERDs with business analysts, developers, and end-users to ensure accuracy
Iterate Through Model Types: Progress from conceptual → logical → physical models as requirements become clearer
Keep Diagrams Readable: Avoid overcrowding; split complex systems into multiple focused diagrams if necessary
Entity Relationship Diagrams are essential tools for database design, providing visual representations of how data entities relate to each other. By understanding the core components—entities, attributes, and relationships—and their various types, you can create effective ERDs that serve multiple purposes:
Database design and planning for new systems
Problem-solving by identifying design issues in existing databases
Business process reengineering through comprehensive data architecture views
The three model types (conceptual, logical, physical) allow you to communicate at appropriate levels of detail for different audiences, while various ERD styles (Chen, Crow's Foot, IDEF1X, etc.) provide flexibility for different use cases and tools.
By following best practices and using tools like PlantUML to generate clear, maintainable diagrams, you can leverage ERDs to build robust, well-structured databases that accurately reflect your organization's data needs and support efficient information systems.

