
Prioritization is the art and science of deciding what to build first, what to defer, and what to discard. For product managers like yourself with 7+ years of experience, you know that resources—time, budget, and team capacity—are always finite. Effective prioritization ensures that:
Maximum value is delivered with available resources
Stakeholder alignment is maintained
Risk is managed through incremental delivery
Strategic goals are achieved systematically
Whether you're working on use cases (broader system interactions) or user stories (specific implementation tasks), the principles remain similar, though the granularity differs.
| Dimension | Description | Questions to Ask |
|---|---|---|
| Value | Business impact, user benefit, revenue potential | How much value does this create? Who benefits? |
| Effort/Cost | Development time, complexity, resources required | How hard is this to build? What's the cost? |
| Risk | Technical uncertainty, market risk, dependencies | What could go wrong? What do we not know? |
| Urgency | Time sensitivity, deadlines, competitive pressure | Does timing matter? Is there a window? |
| Dependencies | Prerequisites, blocking relationships | Can this be done independently? |
| Strategic Fit | Alignment with roadmap, vision, OKRs | Does this move us toward our goals? |
"Everything is important, so nothing is a priority."
The goal isn't to rank everything as #1—it's to create clear differentiation that drives decision-making.
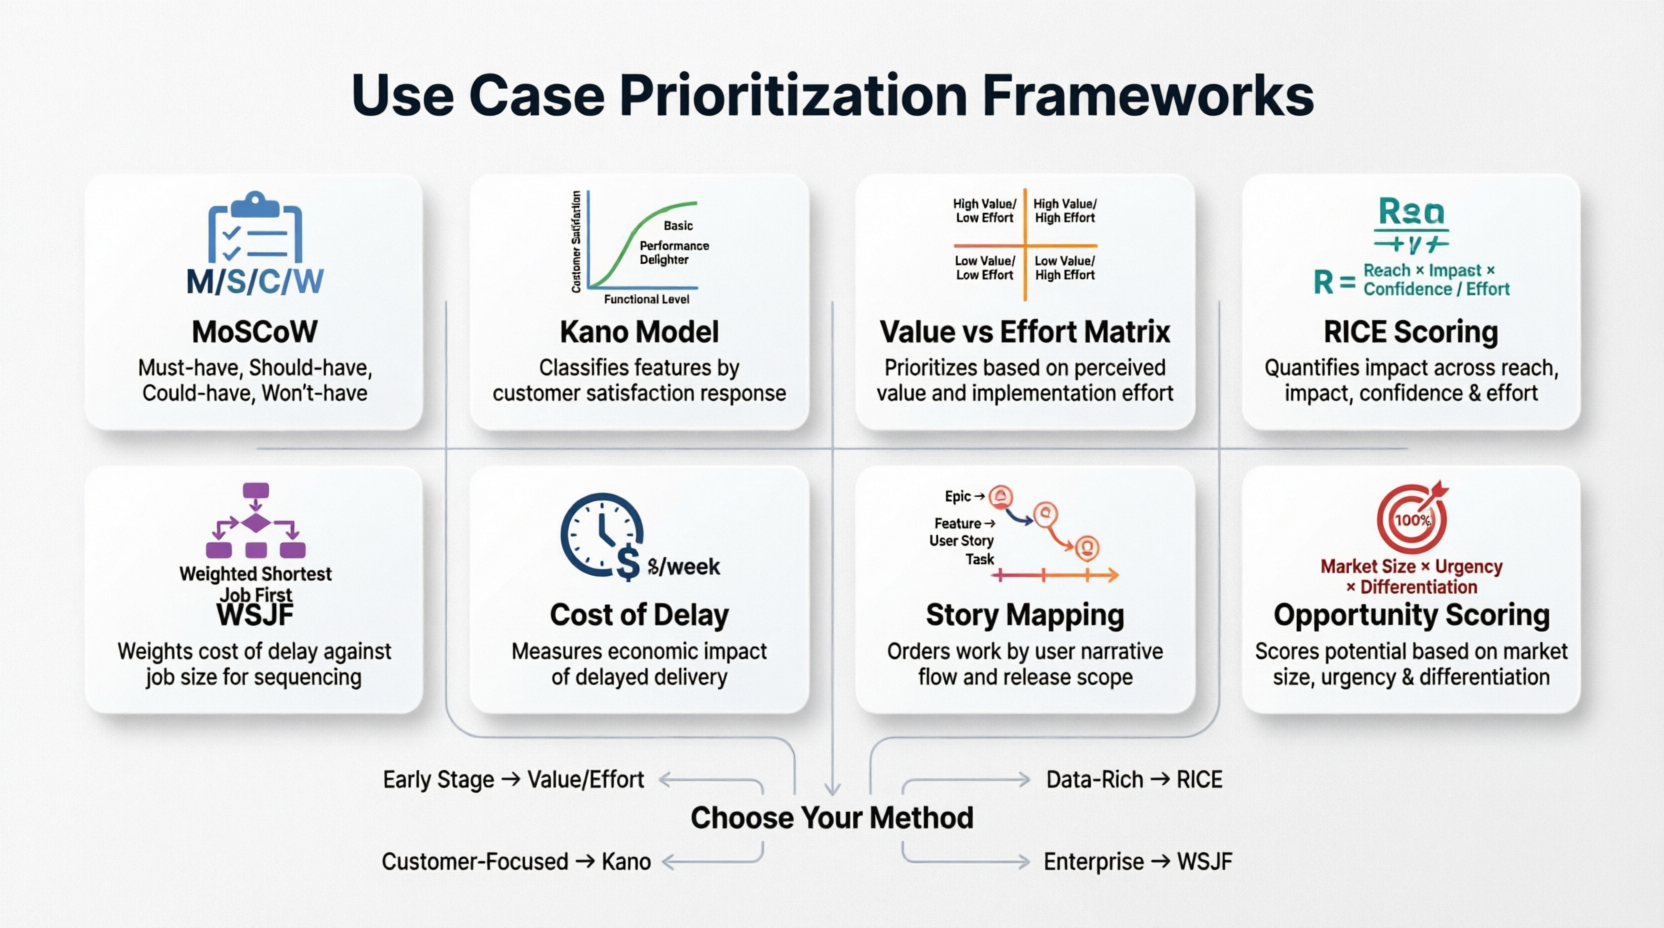
What it is: Categorizes items into four buckets:
Must have: Non-negotiable requirements
Should have: Important but not vital
Could have: Desirable but optional
Won't have (this time): Explicitly deferred
Best for:
Release planning with fixed deadlines
Stakeholder workshops requiring simplicity
Regulatory or compliance-driven projects
Example:
Must Have: User authentication, payment processing
Should Have: Password reset, order history
Could Have: Social login, wish list
Won't Have: AI recommendations (Q1 release)
Pros: Simple, forces trade-offs, clear communication
Cons: Can become "everything is Must Have," lacks granularity within categories
What it is: Quantitative framework scoring on four factors:
Reach: Number of users impacted per time period
Impact: Effect on each user (massive=3, high=2, medium=1, low=0.5, minimal=0.25)
Confidence: Certainty in estimates (100%=1, 80%=0.8, 50%=0.5)
Effort: Person-months required
Formula: RICE Score = (Reach × Impact × Confidence) / Effort
Best for:
Data-driven organizations
Comparing diverse initiatives objectively
Teams with good analytics infrastructure
Example:
Feature: One-click checkout
Reach: 10,000 users/month
Impact: 2 (high)
Confidence: 80% (0.8)
Effort: 2 person-months

RICE Score = (10,000 × 2 × 0.8) / 2 = 8,000
Pros: Objective, accounts for uncertainty, scalable
Cons: Requires data, can be gamed, effort estimation challenges
What it is: Classifies features by customer satisfaction impact:
Basic Needs: Expected; absence causes dissatisfaction, presence doesn't delight
Performance Needs: More is better; linear relationship with satisfaction
Excitement Needs: Unexpected delights; absence doesn't disappoint, presence creates delight
Indifferent: Neither satisfies nor dissatisfies
Reverse: Actually decreases satisfaction
Best for:
Product discovery and innovation
Understanding customer expectations
Balancing foundational vs. differentiating features
Example:
Basic: Fast page load times, secure transactions
Performance: Search result relevance, battery life
Excitement: AR try-on feature, personalized AI assistant
Pros: Customer-centric, reveals hidden expectations, guides innovation
Cons: Requires customer research, subjective classification, needs regular reassessment
What it is: Plots items on a simple matrix:
Quick Wins: High value, low effort → Do first
Major Projects: High value, high effort → Plan carefully
Fill-ins: Low value, low effort → Do when capacity allows
Time Sinks: Low value, high effort → Avoid or eliminate
Best for:
Quick prioritization sessions
Visual stakeholder alignment
Early-stage product development
Pros: Intuitive, fast, visual
Cons: Oversimplifies, binary thinking, doesn't account for dependencies
What it is: From SAFe/Lean methodology:
Formula: WSJF = (User-Business Value + Time Criticality + Risk Reduction/Opportunity Enablement) / Job Size
Best for:
Agile/SAFe environments
Portfolio-level prioritization
When time-to-market is critical
Pros: Considers urgency and risk, Lean-aligned
Cons: Complex scoring, requires training, can be bureaucratic
What it is: Based on customer outcome importance and satisfaction:
Formula: Opportunity Score = Importance + max(Importance - Satisfaction, 0)
Focuses on underserved needs (high importance, low satisfaction)
Best for:
Market research-driven prioritization
Identifying innovation opportunities
Competitive differentiation
Pros: Data-driven, focuses on unmet needs, reduces bias
Cons: Requires extensive customer research, complex analysis
What it is: Quantifies economic impact of not delivering now:
Considers revenue loss, customer churn, competitive disadvantage
Often combined with WSJF
Best for:
Business-case driven decisions
Executive-level discussions
When financial impact is measurable
Pros: Ties to business outcomes, compelling for stakeholders
Cons: Difficult to estimate accurately, may overlook strategic value
What it is: Organizes user stories along a user journey backbone, then slices vertically:
Backbone: Essential user activities
Skeleton: Minimum viable flow
Body: Nice-to-have enhancements
Best for:
MVP definition
Ensuring end-to-end user value
Release planning with user-centric view
Pros: Maintains user context, prevents fragmented releases
Cons: Requires facilitation skills, can be time-consuming
| Technique | Complexity | Data Required | Best Granularity | Stakeholder Friendly | Strategic Alignment |
|---|---|---|---|---|---|
| MoSCoW | Low | Minimal | Feature/Release | ★★★★★ | ★★★ |
| RICE | Medium-High | Analytics | Feature/Initiative | ★★★ | ★★★★ |
| Kano | Medium | Customer Research | Feature/Capability | ★★★★ | ★★★★ |
| Value/Effort | Low | Estimates | Story/Feature | ★★★★★ | ★★ |
| WSJF | High | Multiple inputs | Epic/Initiative | ★★ | ★★★★★ |
| Opportunity | High | Extensive Research | Feature/Market | ★★★ | ★★★★★ |
| Cost of Delay | Medium-High | Financial Data | Initiative/Epic | ★★★★ | ★★★★★ |
| Story Mapping | Medium | User Research | User Story | ★★★★ | ★★★★ |
Quantitative vs. Qualitative:
RICE, WSJF, Opportunity Scoring → Quantitative
MoSCoW, Kano, Value/Effort → Qualitative (though can be quantified)
Speed vs. Rigor:
Quick: MoSCoW, Value/Effort
Rigorous: RICE, Opportunity Scoring, WSJF
Customer-Centric vs. Business-Centric:
Customer: Kano, Opportunity Scoring, Story Mapping
Business: RICE, Cost of Delay, WSJF
→ Use: Value/Effort Matrix + MoSCoW
→ Why: Speed matters, data is scarce, need to validate quickly
→ Use: RICE Scoring
→ Why: Leverage existing data, objective comparisons, scale across teams
→ Use: Kano Model + Story Mapping
→ Why: Understand customer expectations, ensure cohesive user journey
→ Use: WSJF + Cost of Delay
→ Why: Align with framework, consider portfolio-level impact, executive buy-in
→ Use: Opportunity Scoring + Kano
→ Why: Identify unmet needs, differentiate from competitors
→ Use: MoSCoW
→ Why: Clear must-haves, manage scope, stakeholder clarity
→ Use: Cost of Delay + Value/Effort
→ Why: Quantify long-term impact of debt, compare with feature value
Most experienced PMs combine techniques:
Example Combination:
Discovery Phase: Kano Model (understand customer needs)
Initial Filtering: Value/Effort Matrix (quick elimination)
Detailed Scoring: RICE (objective ranking)
Final Validation: MoSCoW (stakeholder alignment on release)
Context: You're at Acme Cloud, building an e-commerce module. Here are candidate features:
| Feature | Estimated Reach | Impact | Confidence | Effort (person-months) |
|---|---|---|---|---|
| One-click checkout | 15,000/mo | 2 (high) | 80% | 2 |
| Product reviews | 25,000/mo | 1.5 (med-high) | 90% | 3 |
| AR try-on | 5,000/mo | 3 (massive) | 50% | 6 |
| Wishlist | 20,000/mo | 1 (medium) | 95% | 1.5 |
| Voice search | 3,000/mo | 2 (high) | 60% | 4 |
RICE Calculation:
One-click checkout: (15,000 × 2 × 0.8) / 2 = 12,000
Product reviews: (25,000 × 1.5 × 0.9) / 3 = 11,250
AR try-on: (5,000 × 3 × 0.5) / 6 = 1,250
Wishlist: (20,000 × 1 × 0.95) / 1.5 = 12,667
Voice search: (3,000 × 2 × 0.6) / 4 = 900
Priority Order: Wishlist > One-click checkout > Product reviews > Voice search > AR try-on
Kano Classification:
Basic: Secure checkout, product images
Performance: Search speed, checkout steps
Excitement: AR try-on, personalized recommendations
Insight: While AR try-on scores low on RICE due to high effort and low confidence, it's an excitement feature that could differentiate. Consider phasing: basic AR in Q3, full AR in Q4 after learning.
Backlog Items:
Email/password signup
Social login (Google, Facebook)
Two-factor authentication (2FA)
Password reset flow
Biometric login (fingerprint/face)
Remember me functionality
Account deletion (GDPR compliance)
Login attempt throttling
MoSCoW Categorization:
Must Have: #1, #4, #7 (legal requirement), #8 (security)
Should Have: #3 (security best practice), #6
Could Have: #2, #5
Won't Have (v1): Advanced biometric options
Value/Effort Assessment:
Quick Wins: #6 (Remember me) - high value, low effort
Major Projects: #3 (2FA) - high value, medium effort
Fill-ins: #2 (Social login) - medium value, low effort
Time Sinks: None identified
Recommendation: Build Must Haves first, then add #6 as quick win, followed by #2 and #3 in next sprint.
Context: Enterprise software with multiple stakeholder groups
Initiatives:
A. Mobile app launch
B. API marketplace
C. Advanced analytics dashboard
D. Single sign-on (SSO) integration
E. Custom workflow builder
WSJF Scoring (scale 1-10):
| Initiative | User-Business Value | Time Criticality | Risk Reduction | Job Size | WSJF |
|---|---|---|---|---|---|
| A. Mobile app | 8 | 6 | 5 | 8 | 2.38 |
| B. API marketplace | 7 | 4 | 7 | 10 | 1.8 |
| C. Analytics dashboard | 9 | 7 | 6 | 6 | 3.67 |
| D. SSO integration | 8 | 9 | 8 | 4 | 6.25 |
| E. Workflow builder | 7 | 5 | 5 | 7 | 2.43 |
Priority: D > C > E > A > B
Rationale: SSO has high time criticality (enterprise deals waiting), moderate effort. Analytics provides high value with reasonable effort.
✅ Combine qualitative and quantitative methods
Use data where available, judgment where necessary
✅ Involve cross-functional stakeholders
Engineering for effort estimates
Sales/Marketing for reach and impact
Design for user value
✅ Re-prioritize regularly
Markets change, learnings emerge, assumptions shift
Review every sprint/quarter depending on cadence
✅ Document your rationale
Future you (and your team) will thank you
Enables transparency and accountability
✅ Consider dependencies explicitly
Use dependency mapping tools
Sequence work to unblock teams
✅ Start with outcomes, not outputs
What problem are we solving?
How will we measure success?
✅ Use relative sizing, not absolute
Fibonacci sequences for effort
T-shirt sizes for initial filtering
❌ "Everything is a priority"
Solution: Force ranking, limit top priorities to 3-5 items
❌ HiPPO effect (Highest Paid Person's Opinion)
Solution: Use data-driven frameworks, facilitate inclusive discussions
❌ Ignoring technical debt
Solution: Allocate capacity (e.g., 20%) for debt reduction
Include debt in prioritization using Cost of Delay
❌ Over-engineering the framework
Solution: Start simple, add complexity only when needed
MoSCoW often suffices for small teams
❌ Not validating assumptions
Solution: Build confidence intervals into estimates
Use experiments to reduce uncertainty before full commitment
❌ Focusing only on new features
Solution: Include optimization, bug fixes, and maintenance in backlog
Balance innovation with stability
❌ Analysis paralysis
Solution: Time-box prioritization sessions
Perfect is the enemy of shipped
Given your background in Human-Computer Interaction from Carnegie Mellon and experience in user research, you have unique advantages:
User-Centric Prioritization:
Use usability testing results to inform priority
Apply heuristic evaluation findings
Consider cognitive load in effort estimates
Research-Informed Confidence Scores:
Higher confidence when backed by user studies
Lower confidence for unvalidated assumptions
Use research to de-risk high-effort items
Accessibility as Priority Factor:
Treat accessibility features as "Must Have" not "Nice to Have"
Consider inclusive design in value calculations
Think of prioritization like composing a photograph:
Foreground (Must Have): Sharp focus, essential elements
Mid-ground (Should Have): Supporting context
Background (Could Have): Atmosphere, nice-to-have details
Out of frame (Won't Have): Deliberate exclusion for clarity
Or like trail running:
Must complete the route: Core functionality
Choose the best path: Optimize for efficiency
Know when to turn back: Recognize sunk costs
Hydrate regularly: Re-prioritize frequently
There is no single "best" prioritization technique. The right approach depends on:
Your context: Stage, industry, team size
Available data: Analytics, research, estimates
Stakeholder needs: Simplicity vs. rigor
Decision velocity: Speed vs. accuracy trade-off
Recommended starting point for most PMs:
Begin with Value/Effort Matrix for quick wins
Layer in RICE for data-driven refinement
Apply MoSCoW for stakeholder alignment
Use Kano periodically for strategic direction
Remember: Prioritization is not a one-time activity—it's an ongoing discipline. The goal isn't perfect prioritization; it's better prioritization than yesterday, leading to better outcomes for users and the business.

