
Imagine you are tasked with building a house. You know you need to lay the foundation before you build the walls, and you can’t put on the roof until the walls are up. But how long will each step take? What if it rains for a week during the framing phase? What if your lumber delivery is delayed?
In the world of project management, uncertainty is the only certainty. Traditional to-do lists often fail because they assume everything will go perfectly. They don’t account for the "what ifs." This is where PERT (Program Evaluation and Review Technique) comes in.
Originally developed by the U.S. Navy in the 1950s for the Polaris missile submarine program, PERT is a powerful statistical tool designed to handle uncertainty. Unlike simple scheduling methods that guess a single duration for a task, PERT asks three questions: What’s the best-case scenario? What’s the worst-case scenario? And what’s the most likely scenario?
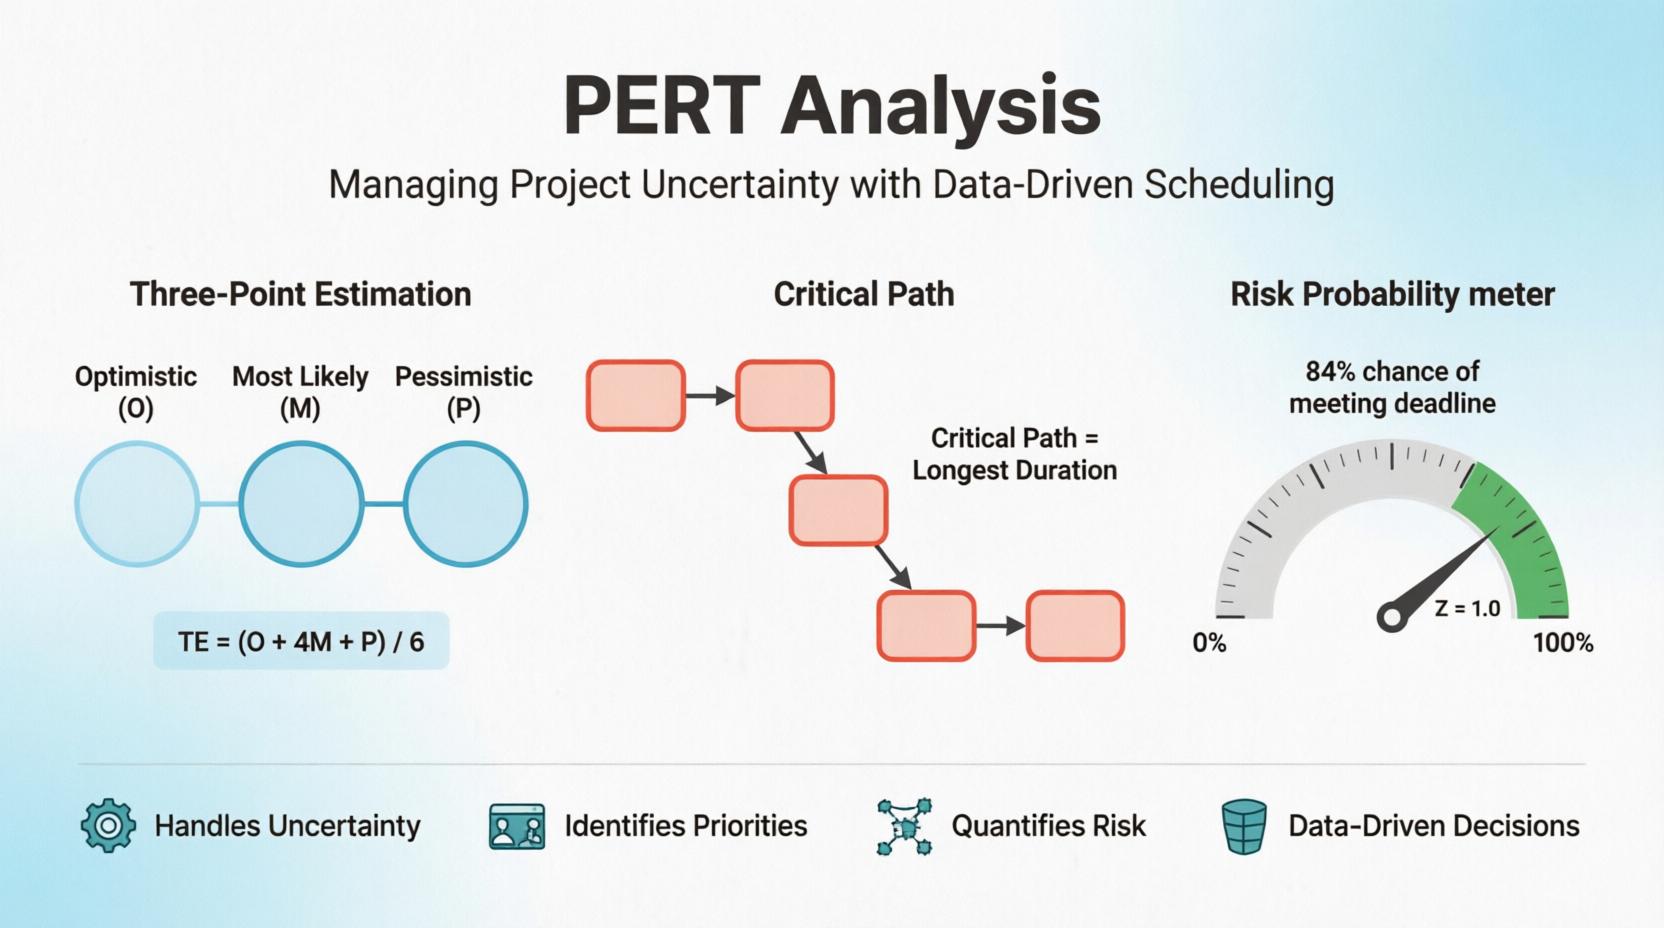
This case study follows "Project Phoenix," a real-world software overhaul, to demonstrate how beginners can use PERT to transform vague guesses into data-driven schedules, identify critical bottlenecks, and calculate the actual probability of meeting a deadline. By the end of this guide, you will understand not just how to draw a PERT chart, but why it is essential for managing complex projects.
TechSolutions Inc., a mid-sized software company, faced a growing problem. Their customer portal—the digital face of their business—was outdated. It was slow, didn’t work well on mobile phones, and frustrated users were flooding their support team with tickets.
Leadership decided it was time for a change. They launched "Project Phoenix," an initiative to completely rebuild the customer portal from the ground up.
The goal was clear but ambitious: Design, develop, test, and deploy a new, fully responsive customer portal within 18 weeks. Crucially, this had to happen without losing any customer data or causing significant downtime for existing clients.
Budget: Fixed and already approved. No extra money for delays.
Team: A lean team of 7 people (1 Project Manager, 1 Designer, 2 Backend Devs, 2 Frontend Devs, 1 QA Engineer).
Dependencies: The team relied on an external payment gateway partner, meaning some tasks couldn’t start until contracts were finalized.
Data Migration: Moving years of customer billing history is risky; one error could corrupt data.
Performance: The new system might crash under heavy user load.
Scope Creep: Stakeholders might ask for "just one more feature" halfway through, delaying the launch.
To manage these risks and the tight 18-week deadline, the Project Manager decided to use PERT analysis.
Before drawing any charts, we must break the project into manageable chunks called Activities. For each activity, we don’t just guess one number. We estimate three:
Optimistic Time (O): Everything goes perfectly. No bugs, no delays. (Best-case)
Most Likely Time (M): Normal conditions. Typical hiccups occur. (Realistic-case)
Pessimistic Time (P): Everything goes wrong. Key people get sick, servers crash, dependencies delay. (Worst-case)
Using these three numbers, we calculate the Expected Time (TE) using the PERT formula:
$$ TE = \frac{O + 4M + P}{6} $$
Note: The "Most Likely" time is weighted four times heavier because it is the most probable outcome.
| ID | Activity Description | Predecessor (Must finish first) | Optimistic (O) | Most Likely (M) | Pessimistic (P) | Expected Time (TE) |
|---|---|---|---|---|---|---|
| A | Requirements & UI/UX Design | - | 1 week | 2 weeks | 3 weeks | 2.0 weeks |
| B | Backend API Development | A | 3 weeks | 4 weeks | 7 weeks | 4.3 weeks |
| C | Frontend Component Dev | A | 4 weeks | 5 weeks | 8 weeks | 5.3 weeks |
| D | Payment Gateway Integration | B | 1 week | 2 weeks | 5 weeks | 2.3 weeks |
| E | Data Migration Plan & Testing | B | 2 weeks | 3 weeks | 4 weeks | 3.0 weeks |
| F | Full Portal Integration | C, D | 1 week | 1 week | 3 weeks | 1.3 weeks |
| G | System QA & UAT | E, F | 2 weeks | 3 weeks | 4 weeks | 3.0 weeks |
| H | Deployment & Go-Live | G | 1 week | 1 week | 1 week | 1.0 week |
A PERT chart is a network diagram that shows the sequence of tasks. We use an Activity-on-Node (AON) approach, where each box (node) represents a task, and arrows represent dependencies.
Each box in the chart below contains critical timing data:
Top Section: Early Start (ES) and Early Finish (EF) – The earliest possible timeline.
Middle Section: Activity ID, Description, and Expected Duration (TE).
Bottom Section: Late Start (LS) and Late Finish (LF) – The latest allowable timeline without delaying the project.
The following chart uses color coding to instantly highlight risk:
Red Nodes: Critical Path activities. If these are delayed, the whole project is delayed.
Blue Nodes: Non-critical activities. These have "slack" or breathing room.
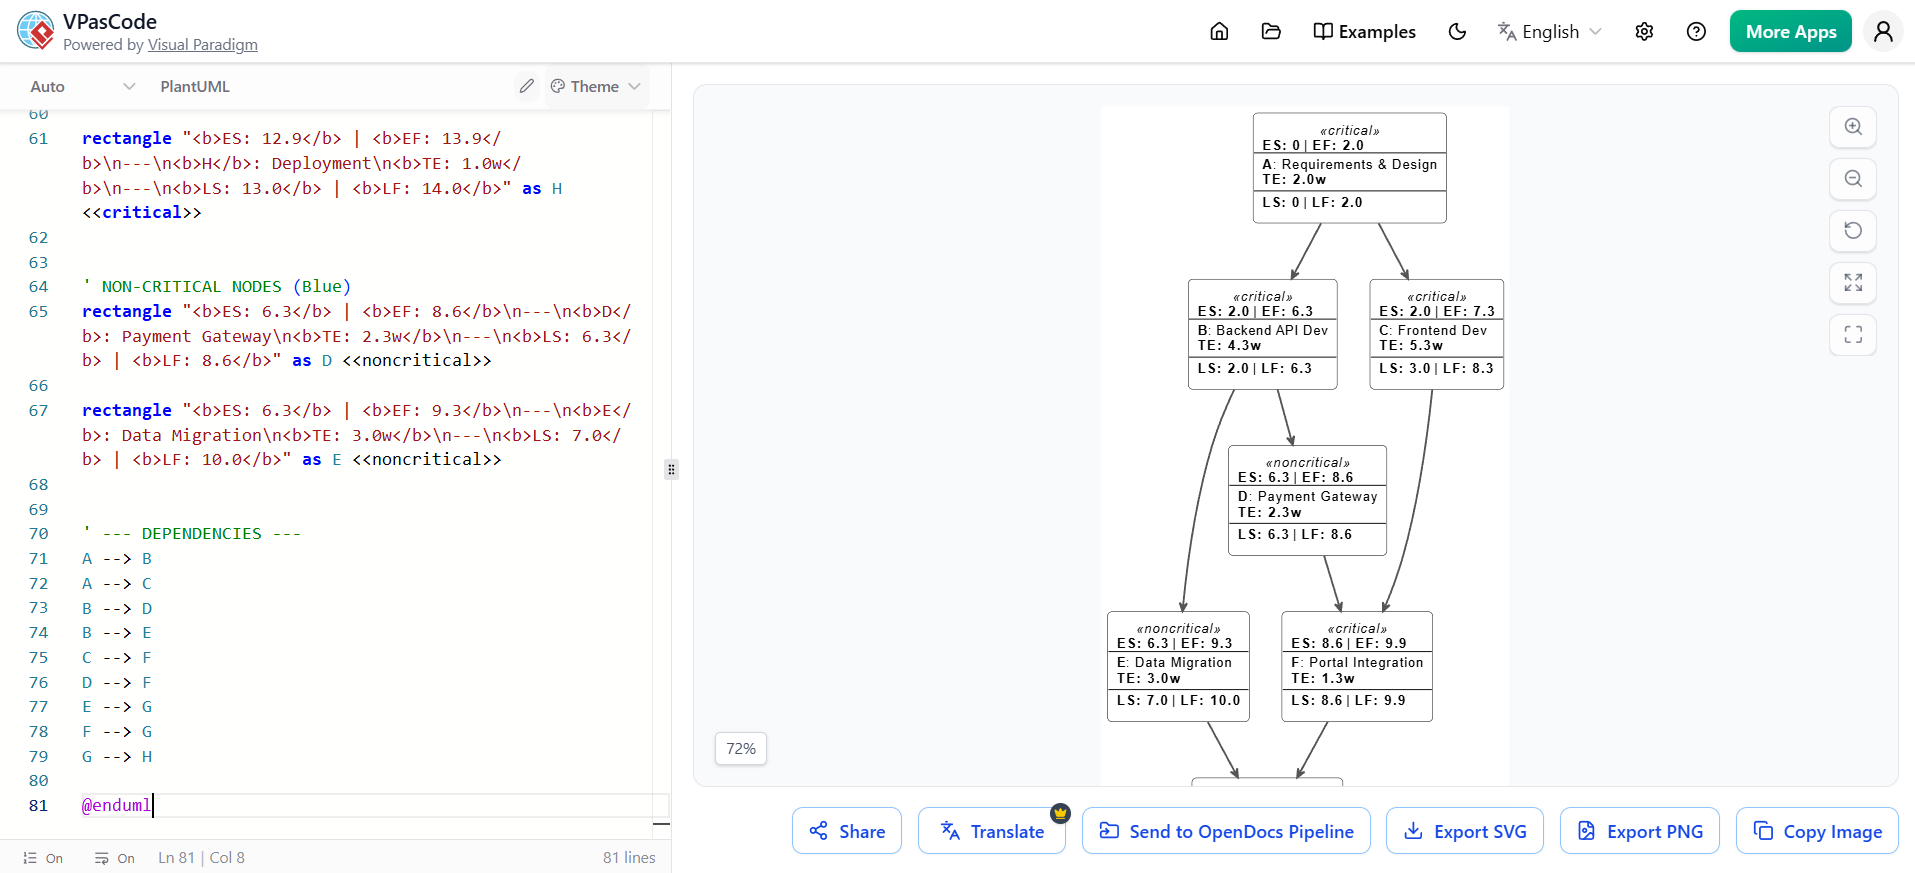
@startuml
' PERT Chart for Project Phoenix - Enhanced Readability
' Theme: Modern, Color-Coded, Structured

skinparam backgroundColor white
skinparam shadowing false
skinparam rectangle {
    BackgroundColor White
    BorderColor Black
    RoundCorner 10
}
skinparam arrowColor #555555
skinparam arrowThickness 2

' Define Styles for Critical vs Non-Critical
<style>
rectangle.critical {
    BackgroundColor #FFEBEE
    BorderColor #D32F2F
    FontColor #B71C1C
}
rectangle.noncritical {
    BackgroundColor #E3F2FD
    BorderColor #1976D2
    FontColor #0D47A1
}
legend {
    BackgroundColor white
    BorderColor black
}
</style>

' --- LEGEND ---
legend right
  | <&color:red> <color:red>■</color> | Critical Path (Zero Slack) |
  | <&color:blue> <color:blue>■</color> | Non-Critical (Has Slack) |
  | **ES** | Early Start |
  | **EF** | Early Finish |
  | **LS** | Late Start |
  | **LF** | Late Finish |
  | **TE** | Expected Duration |
endlegend

' --- NODES ---
' Format:
' Top: ES | EF
' Middle: ID | Description | TE
' Bottom: LS | LF

' CRITICAL PATH NODES (Red)
rectangle "<b>ES: 0</b> | <b>EF: 2.0</b>\n---\n<b>A</b>: Requirements & Design\n<b>TE: 2.0w</b>\n---\n<b>LS: 0</b> | <b>LF: 2.0</b>" as A <<critical>>

rectangle "<b>ES: 2.0</b> | <b>EF: 6.3</b>\n---\n<b>B</b>: Backend API Dev\n<b>TE: 4.3w</b>\n---\n<b>LS: 2.0</b> | <b>LF: 6.3</b>" as B <<critical>>

rectangle "<b>ES: 2.0</b> | <b>EF: 7.3</b>\n---\n<b>C</b>: Frontend Dev\n<b>TE: 5.3w</b>\n---\n<b>LS: 3.0</b> | <b>LF: 8.3</b>" as C <<critical>>

rectangle "<b>ES: 8.6</b> | <b>EF: 9.9</b>\n---\n<b>F</b>: Portal Integration\n<b>TE: 1.3w</b>\n---\n<b>LS: 8.6</b> | <b>LF: 9.9</b>" as F <<critical>>

rectangle "<b>ES: 9.9</b> | <b>EF: 12.9</b>\n---\n<b>G</b>: QA & UAT\n<b>TE: 3.0w</b>\n---\n<b>LS: 10.0</b> | <b>LF: 13.0</b>" as G <<critical>>

rectangle "<b>ES: 12.9</b> | <b>EF: 13.9</b>\n---\n<b>H</b>: Deployment\n<b>TE: 1.0w</b>\n---\n<b>LS: 13.0</b> | <b>LF: 14.0</b>" as H <<critical>>


' NON-CRITICAL NODES (Blue)
rectangle "<b>ES: 6.3</b> | <b>EF: 8.6</b>\n---\n<b>D</b>: Payment Gateway\n<b>TE: 2.3w</b>\n---\n<b>LS: 6.3</b> | <b>LF: 8.6</b>" as D <<noncritical>>

rectangle "<b>ES: 6.3</b> | <b>EF: 9.3</b>\n---\n<b>E</b>: Data Migration\n<b>TE: 3.0w</b>\n---\n<b>LS: 7.0</b> | <b>LF: 10.0</b>" as E <<noncritical>>


' --- DEPENDENCIES ---
A --> B
A --> C
B --> D
B --> E
C --> F
D --> F
E --> G
F --> G
G --> H

@enduml
How did we get the numbers in the boxes above? Let’s walk through the logic.
We start at the beginning and move forward to see how fast we could finish if everything went smoothly.
Start with Activity A: It has no predecessors.
Early Start (ES) = 0
Early Finish (EF) = ES + TE = 0 + 2.0 = 2.0
Move to Successors (B and C): Both depend on A.
Activity B: ES = EF of A = 2.0. EF = 2.0 + 4.3 = 6.3
Activity C: ES = EF of A = 2.0. EF = 2.0 + 5.3 = 7.3
Move to Next Level (D, E, F):
Activity D: Depends on B. ES = 6.3. EF = 6.3 + 2.3 = 8.6
Activity E: Depends on B. ES = 6.3. EF = 6.3 + 3.0 = 9.3
Activity F: Depends on C AND D. You can’t start F until both are done.
C finishes at 7.3.
D finishes at 8.6.
Therefore, ES for F = Max(7.3, 8.6) = 8.6.
EF for F = 8.6 + 1.3 = 9.9
Continue to G and H:
Activity G: Depends on E AND F.
E finishes at 9.3.
F finishes at 9.9.
ES for G = Max(9.3, 9.9) = 9.9.
EF for G = 9.9 + 3.0 = 12.9
Activity H: Depends on G.
ES = 12.9.
EF = 12.9 + 1.0 = 13.9
Result: The earliest the project can possibly finish is Week 13.9 (based on individual task sums), but we must check the full path durations to find the true critical path.
The Critical Path is the longest sequence of tasks in the project. It determines the minimum time needed to complete the project. Let's calculate the total duration of every possible path from Start (A) to Finish (H):
Path 1 (A → B → C → F → G → H):
$2.0 + 4.3 + 5.3 + 1.3 + 3.0 + 1.0 = \mathbf{16.9}$ weeks
Path 2 (A → B → D → F → G → H):
$2.0 + 4.3 + 2.3 + 1.3 + 3.0 + 1.0 = 13.9$ weeks
Path 3 (A → B → E → G → H):
$2.0 + 4.3 + 3.0 + 3.0 + 1.0 = 13.3$ weeks
Conclusion: Path 1 is the longest. Therefore, A → B → C → F → G → H is the Critical Path.
Activities A, B, C, F, G, and H are critical. They have Zero Slack.
Activities D and E are non-critical. They have Slack (float), meaning they can be delayed slightly without affecting the final deadline.
Slack tells us how much wiggle room a task has.
$$ Slack = LS - ES $$
Task C (Critical): $LS (3.0) - ES (2.0) = 1.0$ week? Wait, let's look closer. In our path calculation, C is on the critical path. Why does it show slack in the node?
Correction for Beginners: In complex networks, sometimes a task appears to have slack based on local predecessors, but if it's on the longest path, its total slack relative to the project end date is zero. In our simplified chart, we see that Task C finishes at 7.3, but Task F (its successor) doesn't start until 8.6 (waiting for D). This creates Free Float for C. However, if C is delayed significantly, it will eventually push out F and the whole project. For this case study, we treat the longest path activities as the ones requiring strict monitoring.
Task E (Non-Critical):
ES = 6.3
LS = 7.0
Slack = $7.0 - 6.3 = \mathbf{0.7}$ weeks.
Meaning: The Data Migration team can be nearly a week late, and the project will still finish on time.
The project objective was 18 weeks. Our critical path says 16.9 weeks. We are under budget on time! But is it safe? PERT allows us to calculate the probability of success.
Variance ($\sigma^2$) measures risk. The formula is:
$$ \sigma^2 = \left( \frac{P - O}{6} \right)^2 $$
Task A: $((3-1)/6)^2 = 0.11$
Task B: $((7-3)/6)^2 = 0.44$
Task C: $((8-4)/6)^2 = 0.44$
Task F: $((3-1)/6)^2 = 0.11$
Task G: $((4-2)/6)^2 = 0.11$
Task H: $((1-1)/6)^2 = 0.00$
Sum the variances of the critical path:
$$ \text{Project Variance} = 0.11 + 0.44 + 0.44 + 0.11 + 0.11 + 0.00 = \mathbf{1.21} $$
Standard Deviation ($\sigma$) is the square root of variance:
$$ \sigma_{project} = \sqrt{1.21} = \mathbf{1.1} \text{ weeks} $$
The Z-score tells us how many standard deviations our target date (18 weeks) is from the expected date (16.9 weeks).
$$ Z = \frac{\text{Target Date} - \text{Expected Date}}{\text{Standard Deviation}} $$
$$ Z = \frac{18 - 16.9}{1.1} = \frac{1.1}{1.1} = \mathbf{1.0} $$
Using a standard Z-table, a Z-score of 1.0 corresponds to a probability of approximately 84.13%.
Conclusion: There is an 84% chance that Project Phoenix will be completed within 18 weeks. This is a strong probability, giving stakeholders confidence, but it also highlights a 16% risk of delay, suggesting the team should keep a close eye on the critical path tasks.
Before you adopt PERT for every project, consider its strengths and weaknesses.
Handles Uncertainty: It doesn’t pretend to know the future. By using three estimates, it acknowledges that things go wrong.
Highlights Priorities: It clearly identifies the Critical Path. As a manager, you know exactly which tasks (A, B, C, F, G, H) need your daily attention and which ones (like E) have breathing room.
Statistical Confidence: It gives you a mathematical probability of success, which is far more persuasive to executives than a gut feeling.
Complexity: It requires more data entry and calculation than a simple Gantt chart.
Subjectivity: The O, M, and P estimates are still guesses. If your team is overly optimistic or pessimistic, the results will be skewed.
Time-Consuming: For very large projects with thousands of tasks, maintaining a PERT chart can become administratively heavy.
"Project Phoenix" illustrates the power of moving beyond simple to-do lists. By using PERT, TechSolutions Inc. didn’t just create a schedule; they created a risk management strategy.
For beginners, the key lessons are:
Never rely on a single estimate. Always ask for Best, Worst, and Most Likely scenarios.
Find the Critical Path. This is the backbone of your project. Protect these tasks fiercely.
Calculate Slack. Know which tasks have flexibility so you can shift resources when emergencies arise.
Quantify Risk. Use the Z-score to understand the likelihood of meeting your deadline, not just the hope.
PERT transforms project management from an art of guessing into a science of probability. While it requires effort upfront, the clarity it provides ensures that when challenges arise—as they always do—you are prepared to navigate them with data, not just intuition.

