
In the evolving landscape of project management, the demand for transparency, version control, and collaborative documentation has never been higher. Traditional drag-and-drop diagramming tools, while intuitive, often create silos of information that are difficult to maintain, review, or integrate into development workflows. As projects grow in complexity, managing dependencies and timelines through static images becomes a bottleneck rather than a benefit.
Enter "Diagrams-as-Code"—a methodology that treats visual documentation with the same rigor as software source code. By leveraging tools like PlantUML, project managers can define both high-level dependency logic (PERT charts) and chronological execution schedules (Gantt charts) using simple, text-based syntax. This approach not only ensures that diagrams remain synchronized with project plans but also enables seamless integration into CI/CD pipelines, Git repositories, and collaborative code reviews.
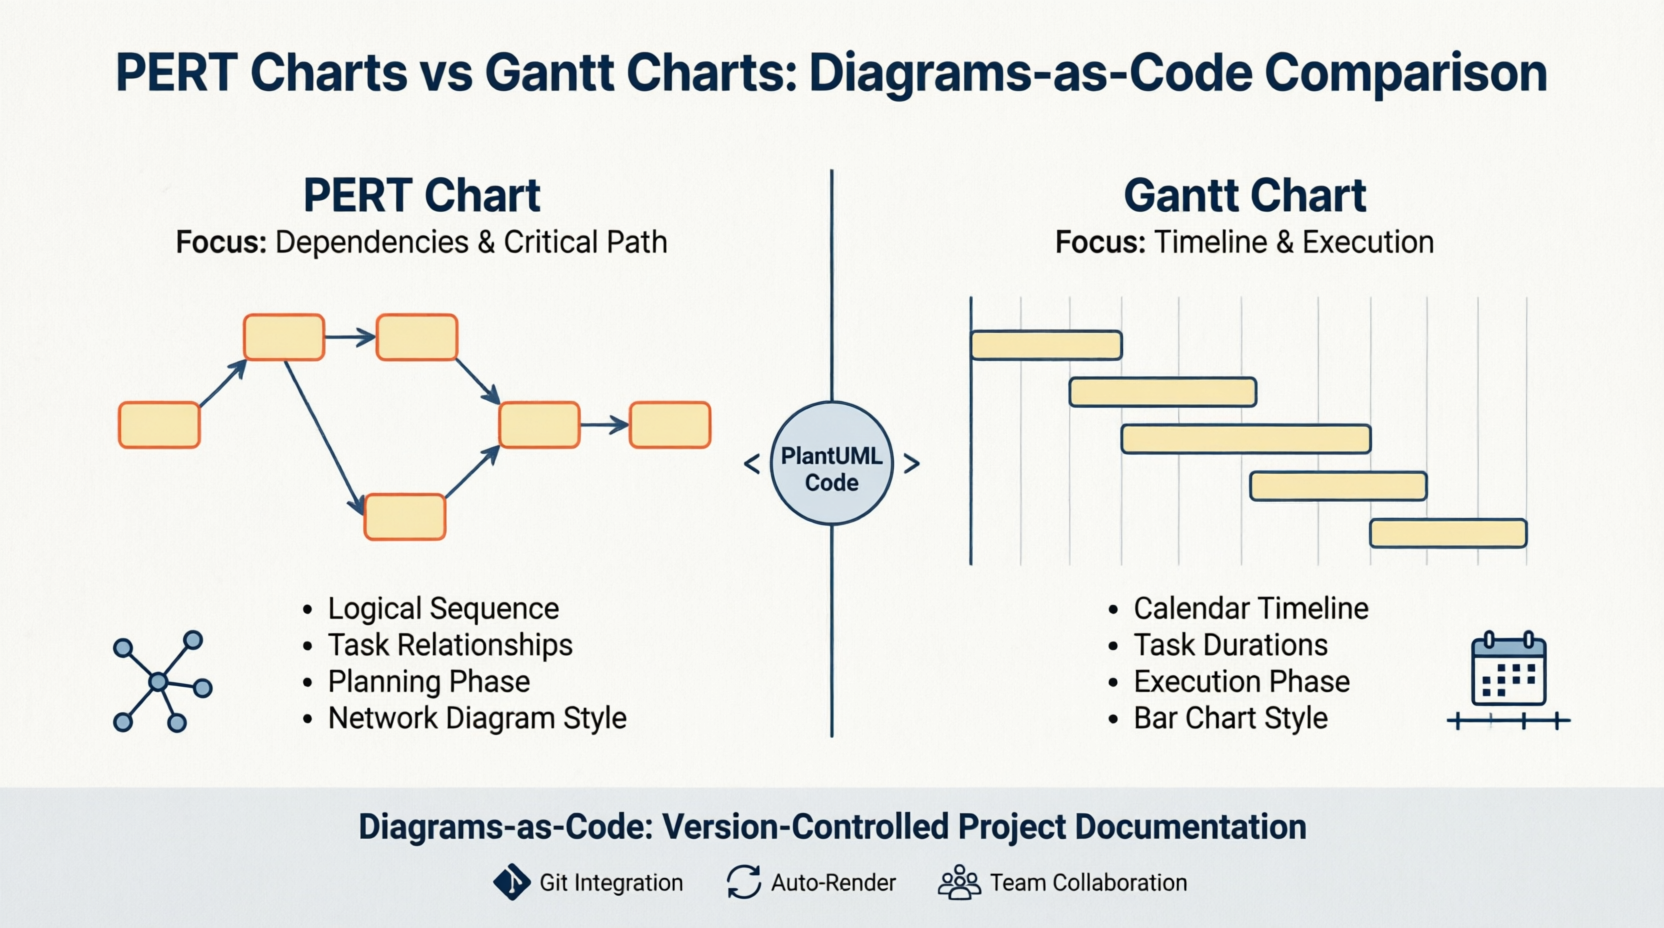
This case study explores how PlantUML can be used to build robust PERT and Gantt charts, highlighting their conceptual differences, providing ready-to-use syntax guidelines, and demonstrating their application through a comprehensive website redesign project. Whether you are planning complex initiatives with uncertain durations or executing day-to-day tasks with strict deadlines, mastering these techniques will elevate your project documentation from static artifacts to dynamic, living assets.
Before diving into implementation, it is crucial to understand when and why to use each chart type. While both serve project planning purposes, they address fundamentally different questions.
| Feature | PERT Chart (Program Evaluation Review Technique) | Gantt Chart |
|---|---|---|
| Primary Focus | Task dependencies, relationships, and critical path. | Chronological timeline, durations, and resource loading. |
| Visual Style | Network diagram (nodes/boxes connected by arrows). | Horizontal bar chart mapped to a calendar grid. |
| Best Used For | Planning complex projects with uncertain task durations. | Executing and tracking day-to-day project progress. |
| Time Focus | Emphasizes logical sequence over calendar dates. | Emphasizes when a task starts and stops in real time. |
Key Insight: Use PERT charts during the planning phase to map out logical dependencies and identify the critical path. Use Gantt charts during the execution phase to track progress against a calendar and manage resources.
PlantUML does not have a native @startpert directive. Instead, developers leverage the flexibility of the Object Diagram (@startuml) syntax to create highly functional and visually clear PERT charts.
Nodes as Objects: Use the syntax object "Task Name" as alias to define milestones or tasks. The alias allows for clean referencing in connections.
Metadata Fields: Inside the object braces {}, list key values such as Duration, Early Start (ES), and Early Finish (EF). This embeds critical scheduling data directly into the visual node.
Directional Flow: Always include left to right direction at the top of your file. This forces a logical left-to-right progression, preventing unreadable vertical cascades.
Connections: Use --> to establish sequential dependencies. Labels on arrows can clarify the nature of the dependency (e.g., "Approval required").
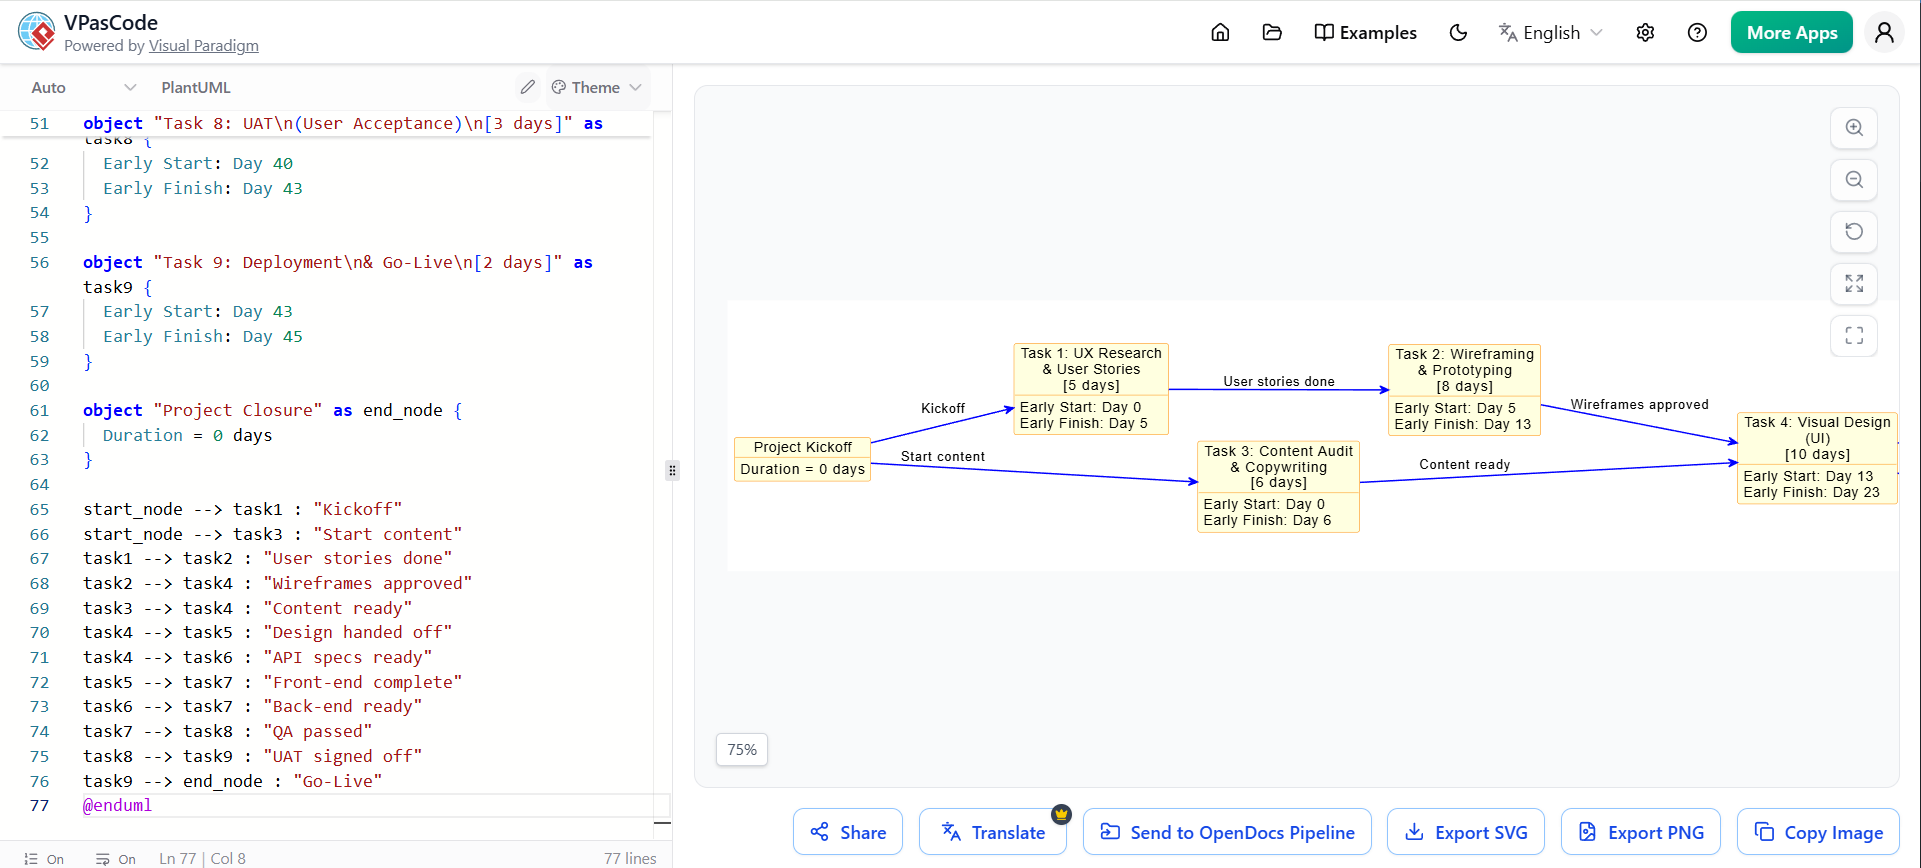
The following code generates a network diagram for a website redesign project, highlighting task dependencies and calculated early start/finish times.
@startuml
left to right direction
title PERT Chart: Website Redesign Project

skinparam object {
    BackgroundColor LightYellow
    BorderColor DarkOrange
    ArrowColor Blue
    ArrowThickness 1.5
}

object "Project Kickoff" as start_node {
  Duration = 0 days
}

object "Task 1: UX Research\n& User Stories\n[5 days]" as task1 {
  Early Start: Day 0
  Early Finish: Day 5
}

object "Task 2: Wireframing\n& Prototyping\n[8 days]" as task2 {
  Early Start: Day 5
  Early Finish: Day 13
}

object "Task 3: Content Audit\n& Copywriting\n[6 days]" as task3 {
  Early Start: Day 0
  Early Finish: Day 6
}

object "Task 4: Visual Design\n(UI)\n[10 days]" as task4 {
  Early Start: Day 13
  Early Finish: Day 23
}

object "Task 5: Front-End\nDevelopment\n[12 days]" as task5 {
  Early Start: Day 23
  Early Finish: Day 35
}

object "Task 6: Back-End\nIntegration\n[8 days]" as task6 {
  Early Start: Day 23
  Early Finish: Day 31
}

object "Task 7: QA Testing\n& Bug Fixes\n[5 days]" as task7 {
  Early Start: Day 35
  Early Finish: Day 40
}

object "Task 8: UAT\n(User Acceptance)\n[3 days]" as task8 {
  Early Start: Day 40
  Early Finish: Day 43
}

object "Task 9: Deployment\n& Go-Live\n[2 days]" as task9 {
  Early Start: Day 43
  Early Finish: Day 45
}

object "Project Closure" as end_node {
  Duration = 0 days
}

start_node --> task1 : "Kickoff"
start_node --> task3 : "Start content"
task1 --> task2 : "User stories done"
task2 --> task4 : "Wireframes approved"
task3 --> task4 : "Content ready"
task4 --> task5 : "Design handed off"
task4 --> task6 : "API specs ready"
task5 --> task7 : "Front-end complete"
task6 --> task7 : "Back-end ready"
task7 --> task8 : "QA passed"
task8 --> task9 : "UAT signed off"
task9 --> end_node : "Go-Live"
@enduml
Analysis: This chart clearly shows that Task 4 (Visual Design) depends on both Task 2 (Wireframing) and Task 3 (Content). Since Task 2 finishes on Day 13 and Task 3 on Day 6, the earliest Task 4 can start is Day 13. This illustrates the concept of the longest path determining the schedule.
Unlike PERT charts, PlantUML features a dedicated, native Gantt syntax (@startgantt) optimized for linear schedules and calendar-based tracking.
Task Definitions: Declared using square brackets and explicit durations: [Task Name] lasts X days.
Milestones: Tasks with zero duration automatically display as diamond-shaped milestones, ideal for marking key events like kickoffs or go-live dates.
Dependency Constraints: Instead of manually drawing arrows, chain tasks sequentially using the syntax: [Task B] starts at [Task A]'s end. This ensures automatic alignment.
The Longest Path Rule: If a task has multiple predecessors, you must manually align it to the longest path element from your PERT calculations. PlantUML will not automatically resolve conflicting start dates; you must specify which predecessor dictates the start time.
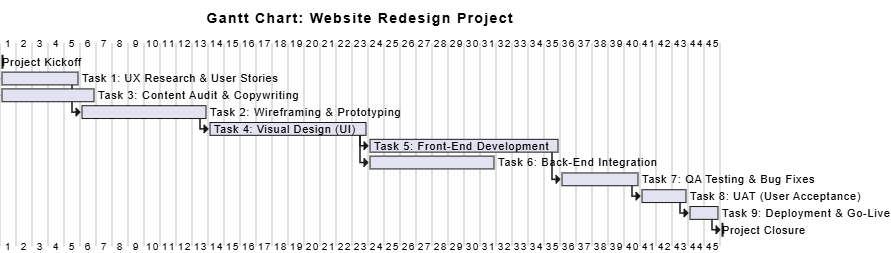
The following code translates the PERT logic into a chronological Gantt chart, ensuring that dependencies are respected and the critical path is maintained.
@startgantt
title Gantt Chart: Website Redesign Project

skinparam gantt {
    TaskBackgroundColor LightYellow
    TaskBorderColor DarkOrange
    ArrowColor Blue
}

' Task Definitions
[Project Kickoff] lasts 0 days
[Task 1: UX Research & User Stories] lasts 5 days
[Task 3: Content Audit & Copywriting] lasts 6 days
[Task 2: Wireframing & Prototyping] lasts 8 days
[Task 4: Visual Design (UI)] lasts 10 days
[Task 5: Front-End Development] lasts 12 days
[Task 6: Back-End Integration] lasts 8 days
[Task 7: QA Testing & Bug Fixes] lasts 5 days
[Task 8: UAT (User Acceptance)] lasts 3 days
[Task 9: Deployment & Go-Live] lasts 2 days
[Project Closure] lasts 0 days

' Sequence Mapping (Using PERT Logic)
[Task 1: UX Research & User Stories] starts at [Project Kickoff]'s end
[Task 3: Content Audit & Copywriting] starts at [Project Kickoff]'s end
[Task 2: Wireframing & Prototyping] starts at [Task 1: UX Research & User Stories]'s end

' Task 4 requires both Task 2 (ends Day 13) and Task 3 (ends Day 6).
' We anchor it to Task 2 to respect the longest path constraint.
[Task 4: Visual Design (UI)] starts at [Task 2: Wireframing & Prototyping]'s end

[Task 5: Front-End Development] starts at [Task 4: Visual Design (UI)]'s end
[Task 6: Back-End Integration] starts at [Task 4: Visual Design (UI)]'s end

' Task 7 requires both Task 5 (ends Day 35) and Task 6 (ends Day 31).
' We anchor it to Task 5 to respect the longest path constraint.
[Task 7: QA Testing & Bug Fixes] starts at [Task 5: Front-End Development]'s end

[Task 8: UAT (User Acceptance)] starts at [Task 7: QA Testing & Bug Fixes]'s end
[Task 9: Deployment & Go-Live] starts at [Task 8: UAT (User Acceptance)]'s end
[Project Closure] starts at [Task 9: Deployment & Go-Live]'s end
@endgantt
Analysis: Notice how Task 4 is explicitly anchored to Task 2’s end, not Task 3’s. This manual intervention ensures the Gantt chart accurately reflects the critical path identified in the PERT analysis. Similarly, Task 7 is anchored to Task 5, the longer of its two predecessors.
To maximize the effectiveness of your PlantUML diagrams, adhere to the following best practices:
Leverage Layout Direction: Always keep left to right direction active in your PERT files. This prevents unreadable, vertical layout cascades and ensures a logical flow that mirrors project progression.
Consolidate Object Names: Use clean, concise aliases (like task1, task2) for your PERT connections. Keep your structural code separate from your descriptive task strings to enhance readability and maintainability.
Calculate Critical Paths First: Before drafting your Gantt chart code, run manual network path calculations to determine early start/finish bounds. This ensures structural alignment between your PERT and Gantt charts and prevents scheduling conflicts.
Version Control Your Diagrams: Store your .puml files in Git alongside your project documentation. This enables change tracking, peer reviews, and historical comparison of project plans.
Automate Rendering: Integrate PlantUML into your CI/CD pipeline or documentation site (e.g., via MkDocs or Sphinx) to automatically generate updated diagrams whenever the source code changes.
The transition from static, image-based diagrams to dynamic, code-driven visuals represents a significant leap forward in project management maturity. By mastering PlantUML for both PERT and Gantt charts, project managers can achieve greater precision, consistency, and collaboration in their planning processes.
PERT charts provide the strategic backbone, revealing dependencies and critical paths that might otherwise remain hidden. Gantt charts translate this logic into actionable timelines, enabling teams to track progress and manage resources effectively. Together, they form a complementary pair that covers both the logical and chronological dimensions of project planning.
As organizations increasingly adopt DevOps and Agile methodologies, the ability to treat documentation as code will become not just a nice-to-have, but a necessity. By embracing tools like PlantUML, project managers can ensure their diagrams remain living, breathing artifacts that evolve alongside their projects—driving clarity, reducing errors, and fostering a culture of transparency and accountability.
Next Steps: Consider expanding this system by adding specific calendar dates, assigning team names to tasks, or highlighting critical path tasks in distinct colors to further enhance visibility and stakeholder communication.

