
The Entity-Relationship Diagram (ERD) is one of software engineering's most enduring artifacts. First formalized by Peter Chen in 1976, it remains a cornerstone of data modeling, bridging the gap between business requirements and technical implementation. But how does this classic tool fit into modern software development? The answer depends heavily on your development methodology—and with the rise of diagram-as-code and AI, the role of ERDs is evolving faster than ever.
An ERD serves as a visual blueprint for how data entities relate within a system. It answers questions like: What data do we need to store? How do different pieces of information connect? What are the rules governing these relationships?
Throughout the Software Development Lifecycle (SDLC), ERDs provide essential value:
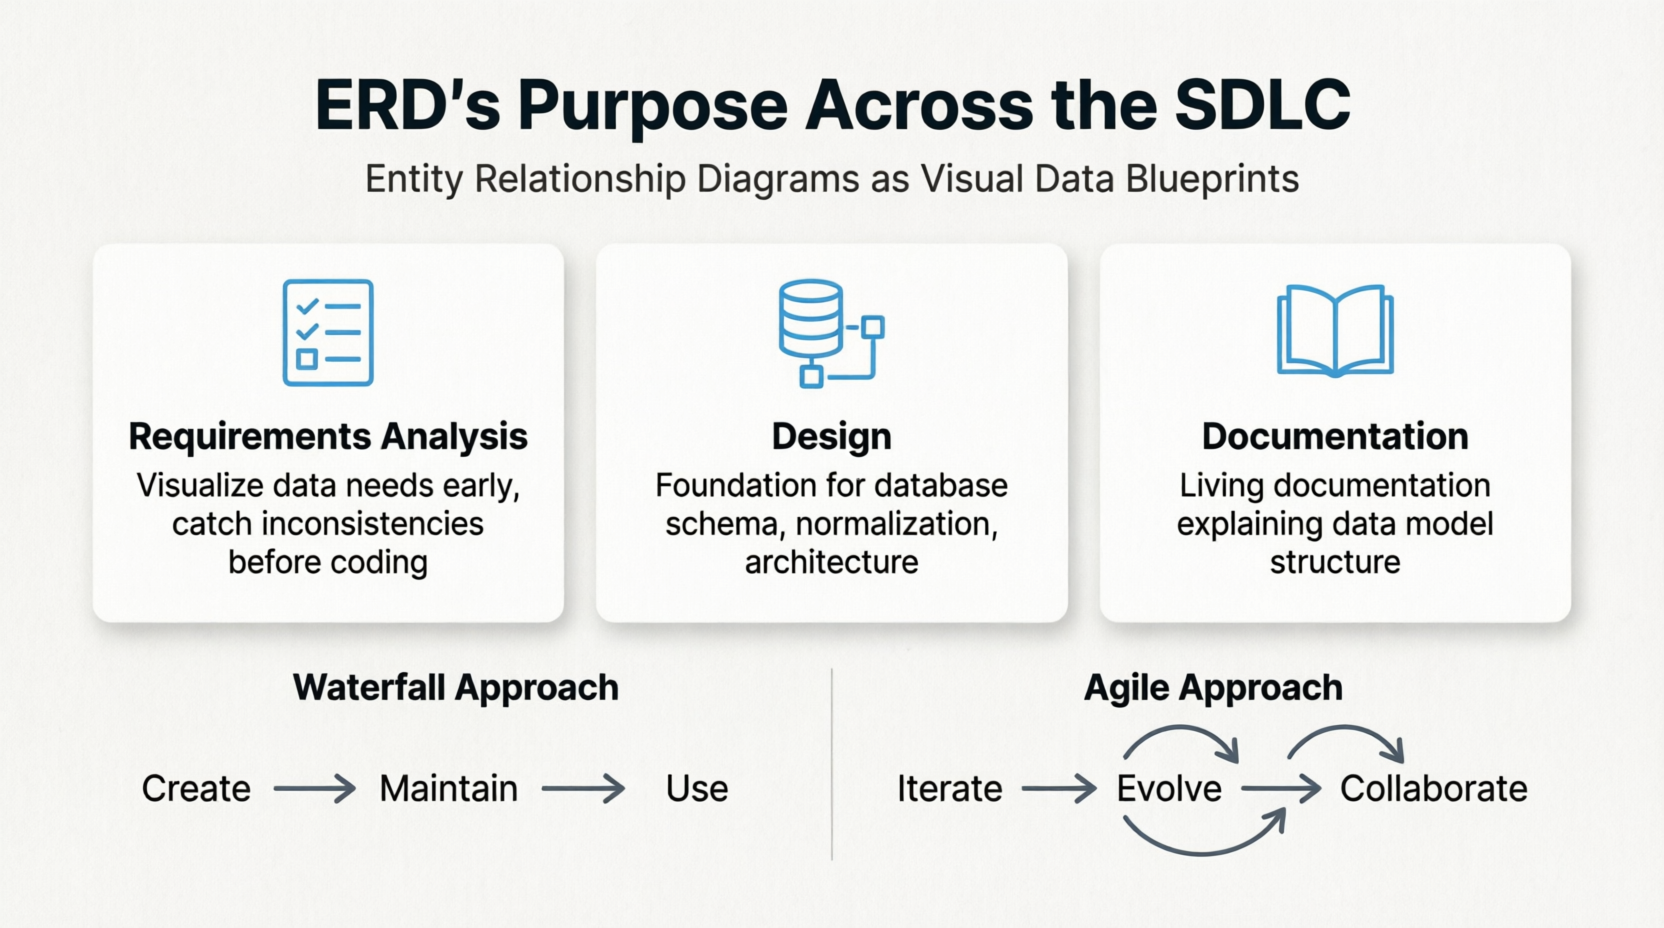
Requirements Analysis: They help stakeholders visualize data needs early, catching inconsistencies before code is written
Design: They form the foundation for database schema creation, normalization, and application architecture
Documentation: They serve as living documentation for current and future developers, explaining the data model's structure and intent
But how an ERD is created, maintained, and used differs dramatically between waterfall and agile approaches.
In traditional waterfall development, the SDLC follows a sequential, phase-gated approach . Requirements are gathered, analyzed, and locked in before design begins. The ERD is created during this upfront design phase and remains largely static thereafter.
The ERD's role in waterfall:
Created early, often by specialized data architects
Captures the complete system data model before implementation starts
Serves as a contract between business stakeholders and the development team
Changes are difficult and expensive, requiring formal change management processes
This approach works well when requirements are stable and well-understood—government systems, financial platforms, or projects with strict regulatory oversight. However, it assumes you can perfectly predict data needs upfront, which rarely holds true in practice.
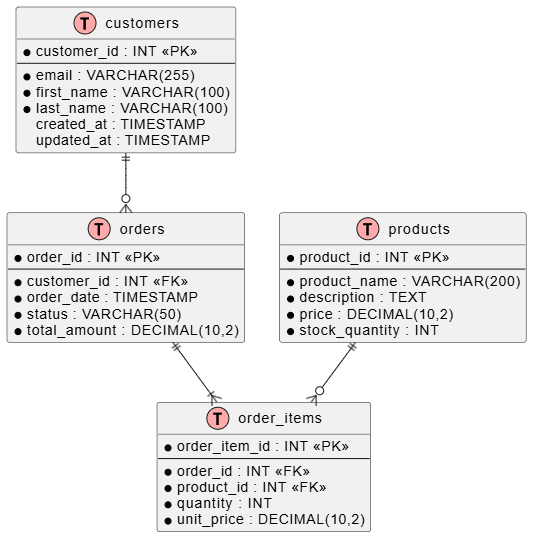
Example PlantUML ERD for a Waterfall-Style E-Commerce System:
@startuml
!define table(x) entity x << (T,#FFAAAA) >>

table(customers) {
    * customer_id : INT <<PK>>
    --
    * email : VARCHAR(255)
    * first_name : VARCHAR(100)
    * last_name : VARCHAR(100)
    created_at : TIMESTAMP
    updated_at : TIMESTAMP
}

table(orders) {
    * order_id : INT <<PK>>
    --
    * customer_id : INT <<FK>>
    * order_date : TIMESTAMP
    * status : VARCHAR(50)
    * total_amount : DECIMAL(10,2)
}

table(order_items) {
    * order_item_id : INT <<PK>>
    --
    * order_id : INT <<FK>>
    * product_id : INT <<FK>>
    * quantity : INT
    * unit_price : DECIMAL(10,2)
}

table(products) {
    * product_id : INT <<PK>>
    --
    * product_name : VARCHAR(200)
    * description : TEXT
    * price : DECIMAL(10,2)
    * stock_quantity : INT
}

customers ||--o{ orders
orders ||--|{ order_items
products ||--o{ order_items
@enduml
This represents a complete data model created upfront, with all entities, attributes, and relationships defined before any development begins.
Agile methodologies take a fundamentally different approach. They embrace change, welcoming evolving requirements even late in development . Instead of a single, upfront ERD, agile teams create simpler data models and evolve them incrementally with each sprint.
The ERD's role in agile:
Created just-in-time for the features being developed in the current sprint
Refactored continuously as understanding grows
Shared and collectively owned by the entire team
Changes are expected and welcomed, not feared
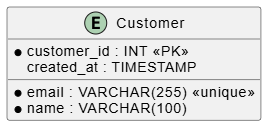
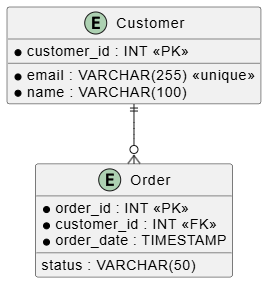
An agile team might start with just the Customer entity for the first sprint, adding Orders in the next sprint, and discovering the need for OrderItems only when payment processing is implemented. The ERD is never truly "finished"—it evolves alongside the code.
Example PlantUML - Evolving Data Model in Agile:
Sprint 1 (Core Customer Management):
@startuml
entity "Customer" {
    * customer_id : INT <<PK>>
    * email : VARCHAR(255) <<unique>>
    * name : VARCHAR(100)
    created_at : TIMESTAMP
}
@enduml
Sprint 2 (Adding Orders):
@startuml
entity "Customer" {
    * customer_id : INT <<PK>>
    * email : VARCHAR(255) <<unique>>
    * name : VARCHAR(100)
}

entity "Order" {
    * order_id : INT <<PK>>
    * customer_id : INT <<FK>>
    * order_date : TIMESTAMP
    status : VARCHAR(50)
}

Customer ||--o{ Order
@enduml
Sprint 3 (Complex Product Structure):
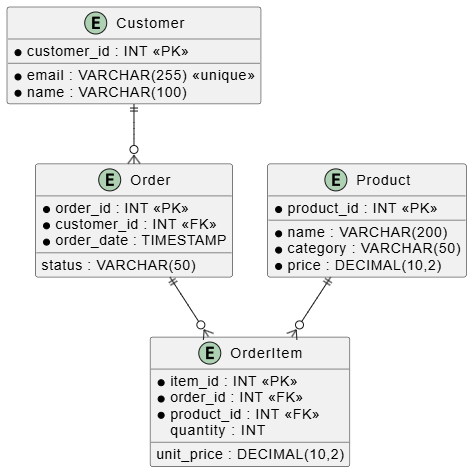
@startuml
entity "Customer" {
    * customer_id : INT <<PK>>
    * email : VARCHAR(255) <<unique>>
    * name : VARCHAR(100)
}

entity "Order" {
    * order_id : INT <<PK>>
    * customer_id : INT <<FK>>
    * order_date : TIMESTAMP
    status : VARCHAR(50)
}

entity "OrderItem" {
    * item_id : INT <<PK>>
    * order_id : INT <<FK>>
    * product_id : INT <<FK>>
    quantity : INT
    unit_price : DECIMAL(10,2)
}

entity "Product" {
    * product_id : INT <<PK>>
    * name : VARCHAR(200)
    * category : VARCHAR(50)
    * price : DECIMAL(10,2)
}

Customer ||--o{ Order
Order ||--o{ OrderItem
Product ||--o{ OrderItem
@enduml
Traditional ERD tools like Lucidchart or draw.io require manual creation and maintenance. When requirements change, someone must drag boxes, redraw lines, and hope they don't miss an update. This manual approach creates a disconnect between diagrams and actual code.
Diagram as code solves this problem. Instead of a visual tool, diagrams are defined in text using languages like PlantUML or Mermaid . This text lives alongside your code in version control, enabling:
Version Control: Every change is tracked, reviewed in pull requests, and reversible
Consistency: Diagrams are always in sync with what they represent
Automation: Diagrams can be generated programmatically from metadata
Collaboration: Team members can suggest changes via pull requests, comment on elements, and see evolution over time
Here's a more comprehensive ERD showing an e-commerce system's data model using PlantUML's syntax:
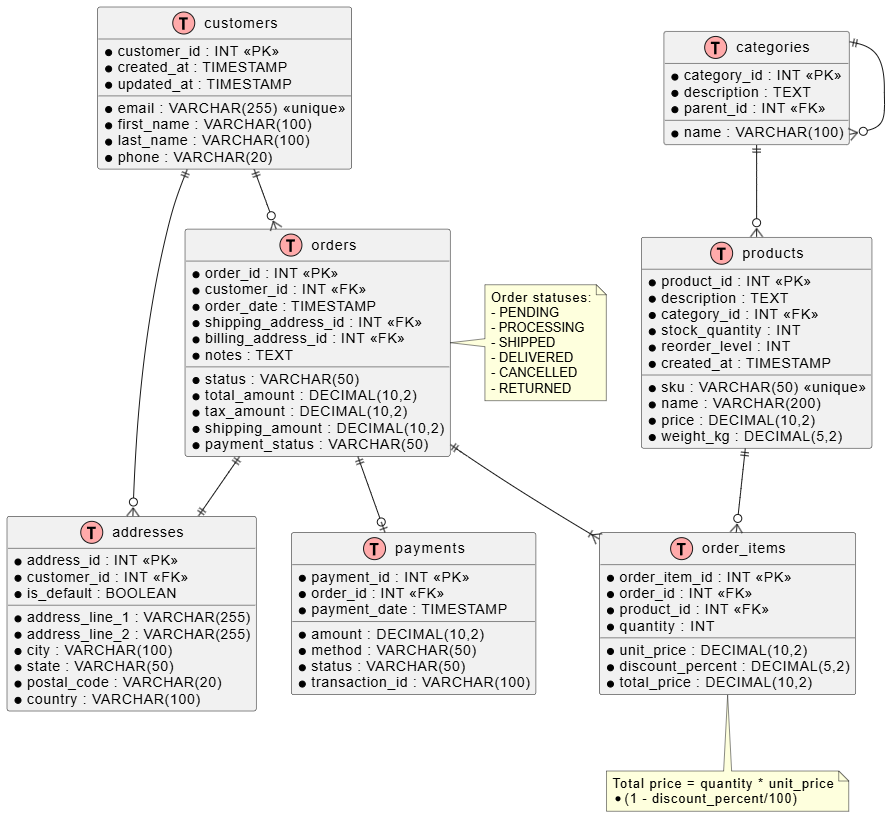
@startuml

!define table(x) entity x << (T,#FFAAAA) >>

!define view(x) entity x << (V,#AAFFAA) >>

' Main Entities

table(customers) {

    * customer_id : INT <<PK>>

    * email : VARCHAR(255) <<unique>>

    * first_name : VARCHAR(100)

    * last_name : VARCHAR(100)

    * phone : VARCHAR(20)

    * created_at : TIMESTAMP

    * updated_at : TIMESTAMP

}

table(addresses) {

    * address_id : INT <<PK>>

    * customer_id : INT <<FK>>

    * address_line_1 : VARCHAR(255)

    * address_line_2 : VARCHAR(255)

    * city : VARCHAR(100)

    * state : VARCHAR(50)

    * postal_code : VARCHAR(20)

    * country : VARCHAR(100)

    * is_default : BOOLEAN

}

table(products) {

    * product_id : INT <<PK>>

    * sku : VARCHAR(50) <<unique>>

    * name : VARCHAR(200)

    * description : TEXT

    * price : DECIMAL(10,2)

    * weight_kg : DECIMAL(5,2)

    * category_id : INT <<FK>>

    * stock_quantity : INT

    * reorder_level : INT

    * created_at : TIMESTAMP

}

table(categories) {

    * category_id : INT <<PK>>

    * name : VARCHAR(100)

    * description : TEXT

    * parent_id : INT <<FK>>

}

table(orders) {

    * order_id : INT <<PK>>

    * customer_id : INT <<FK>>

    * order_date : TIMESTAMP

    * status : VARCHAR(50)

    * total_amount : DECIMAL(10,2)

    * tax_amount : DECIMAL(10,2)

    * shipping_amount : DECIMAL(10,2)

    * shipping_address_id : INT <<FK>>

    * billing_address_id : INT <<FK>>

    * payment_status : VARCHAR(50)

    * notes : TEXT

}

table(order_items) {

    * order_item_id : INT <<PK>>

    * order_id : INT <<FK>>

    * product_id : INT <<FK>>

    * quantity : INT

    * unit_price : DECIMAL(10,2)

    * discount_percent : DECIMAL(5,2)

    * total_price : DECIMAL(10,2)

}

table(payments) {

    * payment_id : INT <<PK>>

    * order_id : INT <<FK>>

    * payment_date : TIMESTAMP

    * amount : DECIMAL(10,2)

    * method : VARCHAR(50)

    * status : VARCHAR(50)

    * transaction_id : VARCHAR(100)

}

' Relationships

customers ||--o{ orders

customers ||--o{ addresses

orders ||--|{ order_items

orders ||--|| addresses

orders ||--o| payments

products ||--o{ order_items

categories ||--o{ products

categories ||--o{ categories

note right of orders

    Order statuses:

    - PENDING

    - PROCESSING

    - SHIPPED

    - DELIVERED

    - CANCELLED

    - RETURNED

end note

note bottom of order_items

    Total price = quantity * unit_price

    * (1 - discount_percent/100)

end note

@endumlWhen combined with AI, diagram-as-code becomes exponentially more powerful. Recent research on using Large Language Models for software development reveals promising capabilities .
Studies have evaluated the ability of LLMs like ChatGPT to understand ERDs and generate artifacts from them . Key findings include:
Comprehension: AI can identify entity types, relationships, and cardinalities, often describing diagrams with high accuracy (rated 5/5 in studies)
Schema Generation: AI can translate ERDs into database schema (SQL CREATE statements), adding attributes like primary and foreign keys appropriately, though accuracy varies based on diagram completeness
Enhancement: AI can suggest improvements—adding new entities, attributes, and relationships that might be missing from original diagrams
Reverse Engineering: AI can recreate diagrams from existing database schema, supporting documentation of legacy systems
1. Natural Language to ERD
AI tools like DiagramGPT can transform free-text descriptions or code snippets into visual diagrams . A business analyst can describe "a customer system with orders, products, and payments" and receive a complete ERD in seconds.
2. Automated Documentation Generation
Platforms like Paradime's DinoAI automatically generate Mermaid ERDs directly from dbt model definitions with a single click . This eliminates manual diagramming and ensures perfect synchronization between code and documentation.
3. Evolutionary Database Design
AI can analyze an existing database and suggest optimal normalization levels, identify missing relationships, and recommend indexes—continuously improving the data model as the application evolves .
4. Impact Analysis
When changing a data model, AI can automatically update related ERDs, identify affected downstream applications, and even suggest migration scripts—reducing the risk of breaking changes.
Step 1: Natural Language Prompt
Prompt: "Create a PlantUML ERD for a library management system with members, books, categories, and loans. Include appropriate relationships and constraints."
Step 2: AI-Generated PlantUML
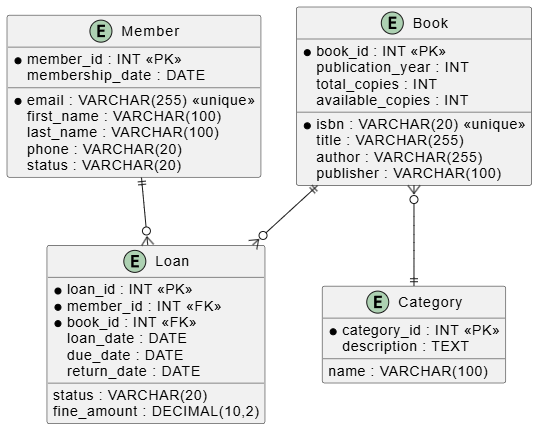
@startuml
entity "Member" {
    * member_id : INT <<PK>>
    * email : VARCHAR(255) <<unique>>
    first_name : VARCHAR(100)
    last_name : VARCHAR(100)
    phone : VARCHAR(20)
    membership_date : DATE
    status : VARCHAR(20)
}

entity "Book" {
    * book_id : INT <<PK>>
    * isbn : VARCHAR(20) <<unique>>
    title : VARCHAR(255)
    author : VARCHAR(255)
    publisher : VARCHAR(100)
    publication_year : INT
    total_copies : INT
    available_copies : INT
}

entity "Category" {
    * category_id : INT <<PK>>
    name : VARCHAR(100)
    description : TEXT
}

entity "Loan" {
    * loan_id : INT <<PK>>
    * member_id : INT <<FK>>
    * book_id : INT <<FK>>
    loan_date : DATE
    due_date : DATE
    return_date : DATE
    status : VARCHAR(20)
    fine_amount : DECIMAL(10,2)
}

Member ||--o{ Loan
Book ||--o{ Loan
Book }o--|| Category
@enduml
Step 3: Iterative Refinement
The analyst can then refine the AI-generated diagram: "Add a library_fines table and track returned status separately." The AI updates the PlantUML accordingly, maintaining consistency.
1. Real-Time Synchronization
Diagrams live alongside code, preventing the "documentation drift" common with traditional tools . When code changes, diagrams can be automatically updated.
2. Democratized Diagramming
Non-technical stakeholders can create accurate diagrams through natural language, bridging the gap between business and technical teams . Business analysts no longer need to learn complex syntax.
3. Instant Feedback
AI provides immediate previews and suggestions, accelerating iteration cycles . What took hours in a manual tool now takes seconds.
4. Git-Native Collaboration
Diagrams are reviewed, commented on, and versioned like any other code, making documentation a natural part of the development workflow .
5. Legacy System Documentation
AI can reverse-engineer ERDs from existing databases, bringing legacy systems up to modern documentation standards .
The ERD remains indispensable, but its role in the SDLC is transforming. In traditional waterfall, ERDs are upfront artifacts that freeze requirements. In agile, they evolve continuously alongside the code. With diagram-as-code and AI, they become living, self-updating documentation that keeps pace with development velocity.
The future of ERDs is one where:
Natural language replaces manual drawing
AI accelerates creation and refinement
Code serves as the single source of truth
Version control tracks every change
Automation ensures perfect synchronization
By embracing diagram-as-code tools like PlantUML and Mermaid, augmented by AI assistants, teams can spend less time maintaining documentation and more time delivering value. The ERD is no longer just a design artifact—it's an intelligent, integrated part of the entire software development lifecycle.

