
In the realm of business modeling and systems engineering, visual representation is crucial for understanding complex workflows, identifying bottlenecks, and ensuring seamless communication between stakeholders. The Unified Modeling Language (UML) provides a standardized way to visualize system design, but choosing the right diagram for the right context is essential.
Among the most widely used UML diagrams are Activity Diagrams and Sequence Diagrams. While both are instrumental in describing system behavior, they differ significantly in their focus, structural representation, and the way they model participants and time. This comprehensive guide will explore the key concepts, structural differences, and practical applications of both diagrams, complete with PlantUML examples, to help you choose the right tool for your business modeling needs.
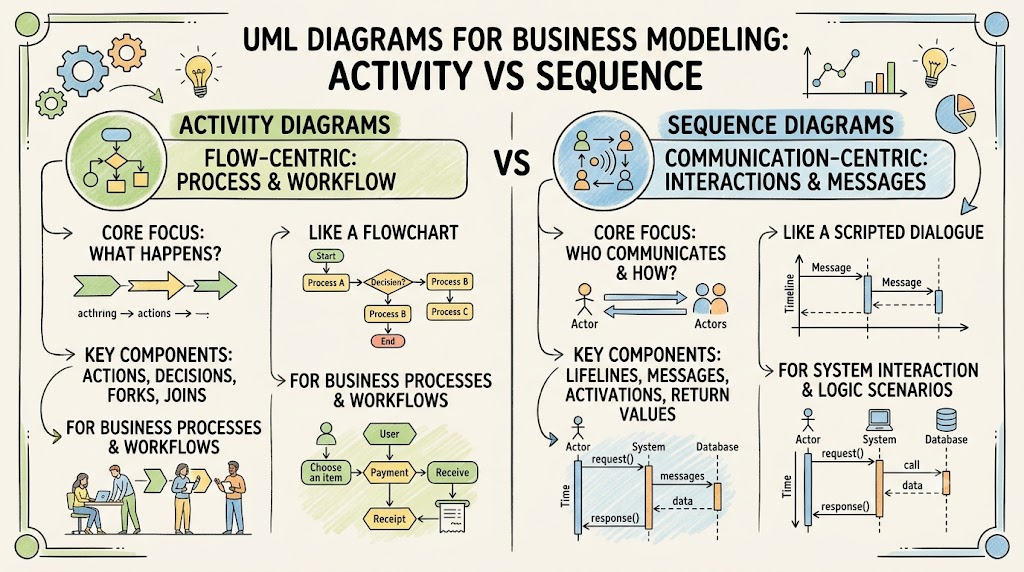
Before diving into the structural differences, it is important to understand the core philosophy behind each diagram type:
Activity Diagrams: Think of these as the UML equivalent of a flowchart. They are fundamentally concerned with the work being performed. They map out the sequence of actions, decisions, and flows required to achieve a specific business goal or complete a process.
Sequence Diagrams: Think of these as a scripted dialogue or interaction log. They are fundamentally concerned with communication. They map out how different entities (objects, systems, or actors) collaborate by exchanging specific messages in a strict chronological order to realize a scenario.
Activity diagrams focus on the flow of a process. They are particularly useful for analyzing high-level business workflows, reengineering business processes, and identifying opportunities for parallel processing. They answer the question: "What steps are taken, and in what logical order, to complete this task?"
Flow and Logic: Activity diagrams represent flow through edges and arrows connecting actions. They do not have a formal time axis.
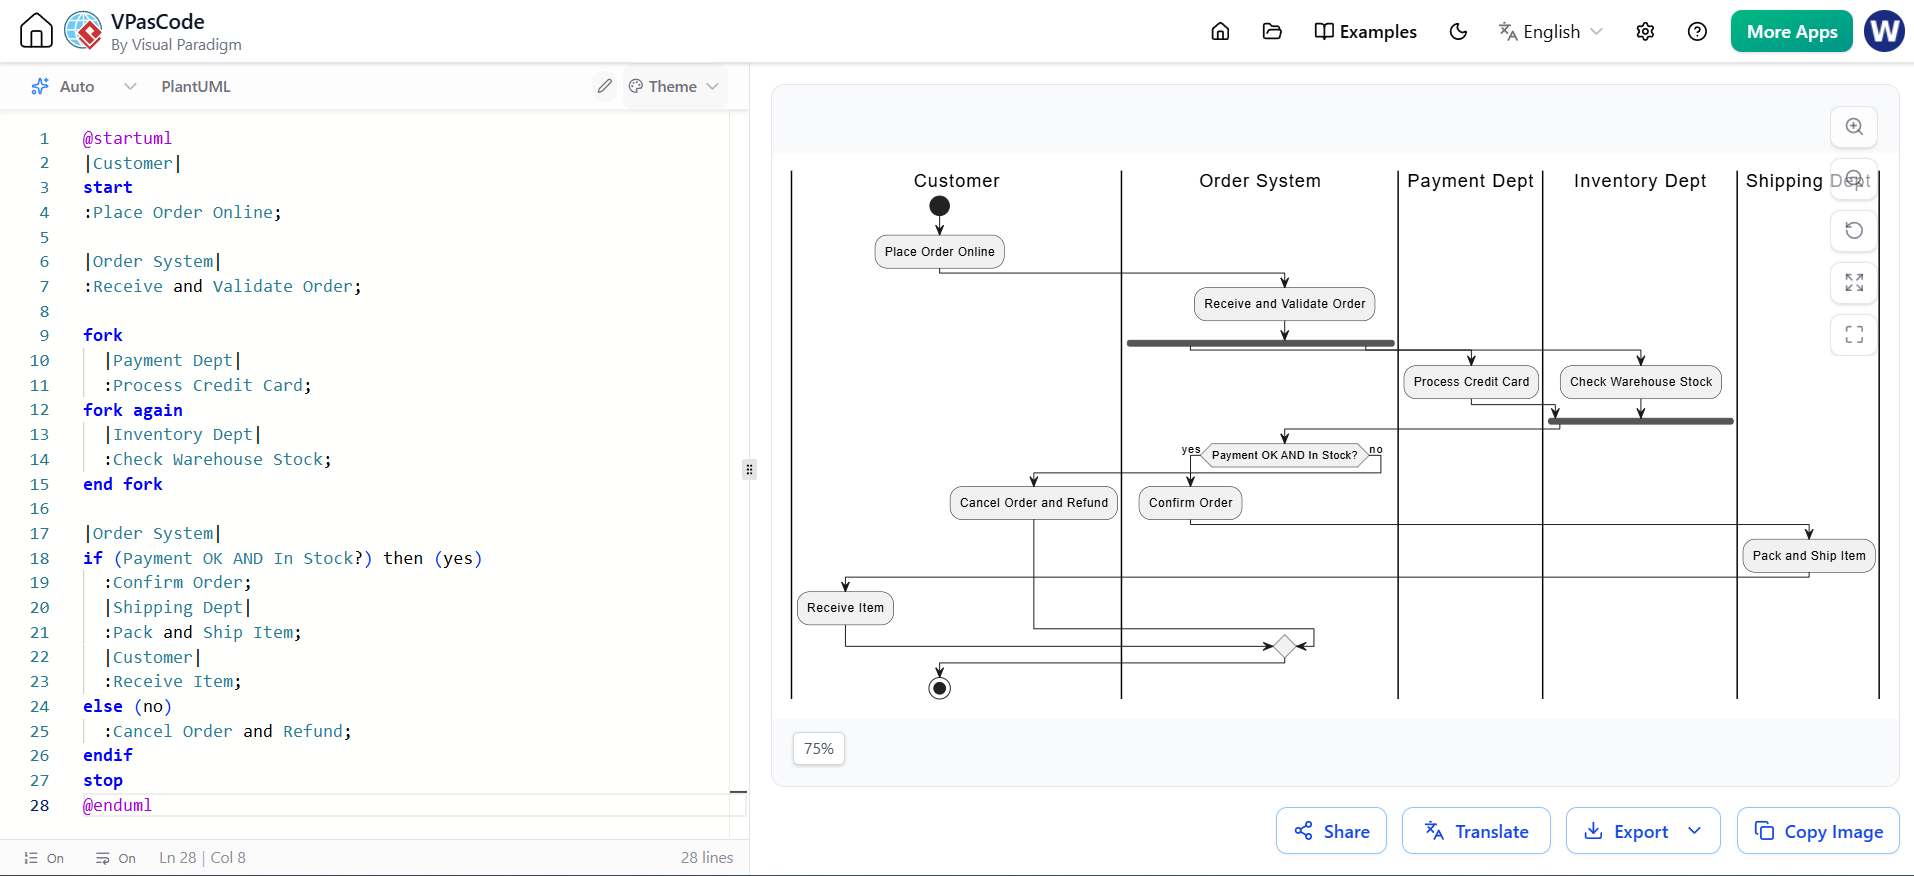
Parallelism: They are superior for modeling complex synchronization, alternatives, and parallel behavior using "forks" (splitting a flow into concurrent paths) and "joins" (merging concurrent paths back together).
Participants (Swimlanes): Responsibility is assigned using swimlanes (also known as activity partitions). These vertical or horizontal lanes clearly show which person, department, or system is responsible for a specific group of actions.
This example demonstrates parallel processing (forks) and departmental responsibility (swimlanes).
@startuml
|Customer|
start
:Place Order Online;

|Order System|
:Receive and Validate Order;

fork
  |Payment Dept|
  :Process Credit Card;
fork again
  |Inventory Dept|
  :Check Warehouse Stock;
end fork

|Order System|
if (Payment OK AND In Stock?) then (yes)
  :Confirm Order;
  |Shipping Dept|
  :Pack and Ship Item;
  |Customer|
  :Receive Item;
else (no)
  :Cancel Order and Refund;
endif
stop
@enduml
Sequence diagrams emphasize communication and interaction. Instead of focusing on the work itself, they show how different entities collaborate. They are frequently preferred for communicating with external partners and customers because they require fewer graphical elements and clearly illustrate the "dialogue" between external actors and the system. They answer the question: "Who is talking to whom, what data are they passing, and in what exact order?"
Time Axis: Sequence diagrams feature a distinct vertical time axis read from top to bottom. The chronological order of interactions is immediately apparent based on the vertical placement of messages.
Information Exchange: They explicitly document the information (business objects) passed between parties (e.g., a passenger handing a specific ticket to a check-in employee).
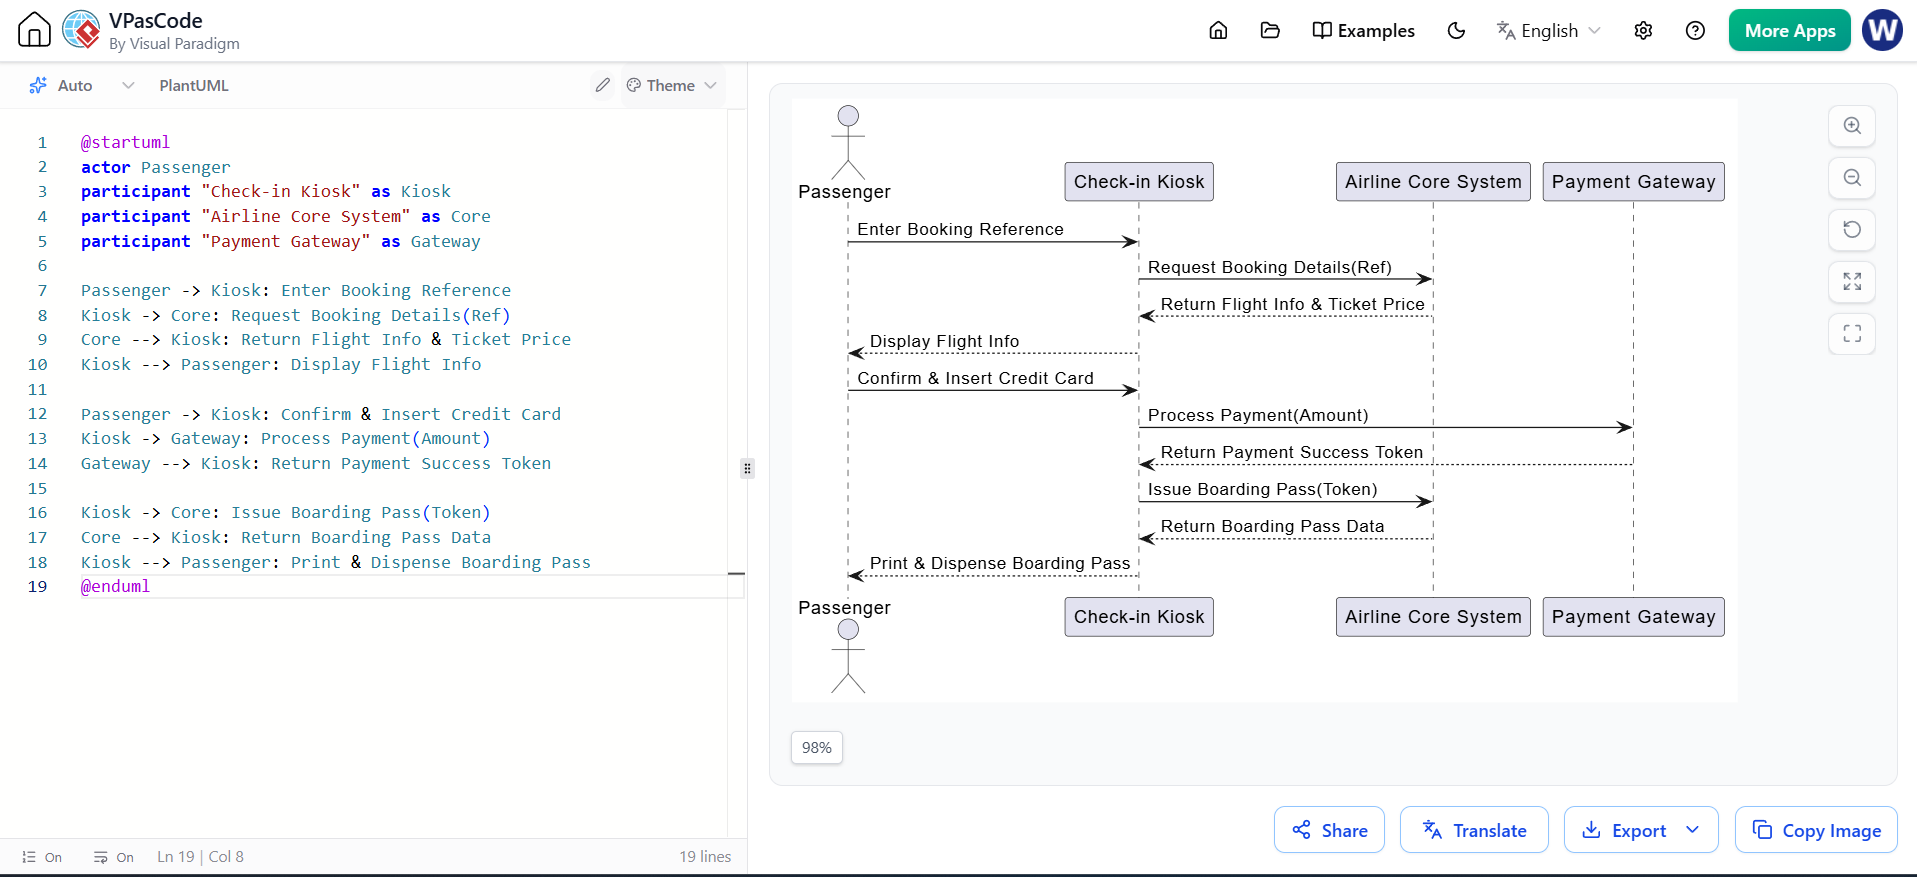
Participants (Lifelines): Participants are represented as lifelines (rectangles at the top with a dashed vertical line extending downward), placing them horizontally across the diagram to show their existence over time.
Interaction Frames: While typically showing a linear chain of events, modern sequence diagrams use "interaction frames" (like par for parallel or alt for conditional logic) to show complex behaviors.
This example demonstrates the chronological exchange of messages and business objects between a passenger, a kiosk, and backend systems.
@startuml
actor Passenger
participant "Check-in Kiosk" as Kiosk
participant "Airline Core System" as Core
participant "Payment Gateway" as Gateway

Passenger -> Kiosk: Enter Booking Reference
Kiosk -> Core: Request Booking Details(Ref)
Core --> Kiosk: Return Flight Info & Ticket Price
Kiosk --> Passenger: Display Flight Info

Passenger -> Kiosk: Confirm & Insert Credit Card
Kiosk -> Gateway: Process Payment(Amount)
Gateway --> Kiosk: Return Payment Success Token

Kiosk -> Core: Issue Boarding Pass(Token)
Core --> Kiosk: Return Boarding Pass Data
Kiosk --> Passenger: Print & Dispense Boarding Pass
@enduml
To easily decide which diagram to use, refer to this comparative breakdown:
| Feature | Activity Diagram | Sequence Diagram |
|---|---|---|
| Metaphor | Flowchart | Dialogue / Inter-object messaging |
| Main Focus | Work performed and process flow | Communication and timing of interactions |
| Participant Tool | Swimlanes (Activity Partitions) | Lifelines (Horizontal placement) |
| Time Representation | No formal time axis; flow via arrows | Vertical time axis (top-to-bottom) |
| Logic Strengths | Parallelism (forks/joins) and branching | Chronological message sequencing |
| Data Exchange | Focuses on actions; object flows are secondary | Explicitly documents business objects passed |
| Best Used For | Reengineering business processes; Internal/External process views | Defining message exchange protocols; API design; Partner communication |
Both Activity and Sequence diagrams are indispensable tools in business modeling, but they serve distinctly different purposes.
Use Activity Diagrams when you need to map out the "big picture" of a business process, identify which departments are responsible for what tasks (via swimlanes), and optimize workflows through parallel processing. They are the go-to choice for business analysts looking to reengineer internal operations.
Conversely, use Sequence Diagrams when you need to drill down into the technical or operational "dialogue" of a specific scenario. When you need to define exact API calls, document the precise exchange of business objects, or communicate interaction protocols to external partners and developers, sequence diagrams provide the chronological clarity required.
Ultimately, these diagrams are not mutually exclusive. In a comprehensive business modeling project, an Activity Diagram is often used first to define the overall process flow, followed by Sequence Diagrams to detail the specific system interactions required to execute each step of that process. Mastering both ensures you can communicate effectively with everyone from high-level business stakeholders to technical development teams.

