
Software architecture documentation is notoriously difficult to get right. Too much detail overwhelms the reader, while too little leaves critical implementation gaps. For years, the industry struggled to find the "Goldilocks zone" of architectural communication—until Simon Brown introduced the C4 Model.
However, even with the C4 model, teams often fall into the trap of trying to map everything at once, resulting in massive, unreadable "spaghetti" diagrams. The true power of the C4 model lies in a concept we call Selective Decomposition: the understanding that architecture is not about showing everything at once, but about choosing ONE element to explore in greater detail, which then reveals MANY details below it.
This guide explores the updated visual representation of the C4 model's 1.. (one-to-many) hierarchical relationships*. Furthermore, we will demonstrate how to implement these concepts in practice using a modern, AI-driven toolchain: Visual Paradigm AI for intelligent generation, VPasCode for diagram-as-code integration, and OpenDocs for living documentation.
To truly grasp the C4 model, we must visualize how each level breaks down into the next. Below is the updated C4 Model diagram that clearly illustrates the hierarchical relationships between each level.
Creating and maintaining these diagrams manually is a recipe for outdated documentation. By leveraging a modern toolchain, you can automate, version-control, and publish your C4 models seamlessly.
Visual Paradigm AI acts as your architectural co-pilot. By feeding it high-level system descriptions or existing codebases, the AI can suggest initial C4 structures, automatically layout the 1..* relationships, and apply the correct color-coded visual hierarchies without manual drag-and-drop effort.
VPasCode brings the power of Visual Paradigm directly into your IDE (like VS Code). It allows you to write C4 diagrams using PlantUML syntax. This means your architecture lives right next to your source code, is tracked in Git, and benefits from code reviews.
OpenDocs takes the PlantUML code generated in VPasCode and compiles it into beautiful, version-controlled, web-based documentation. It ensures that your C4 diagrams are always in sync with your codebase, providing a single source of truth for both developers and stakeholders.
Let’s translate the 1..* selective decomposition concept into actual C4 PlantUML code. Below are examples of how to structure your diagrams at each level, emphasizing the drill-down approach.
At this level, we define the 1 System and its interactions with external users and systems (the "MANY").
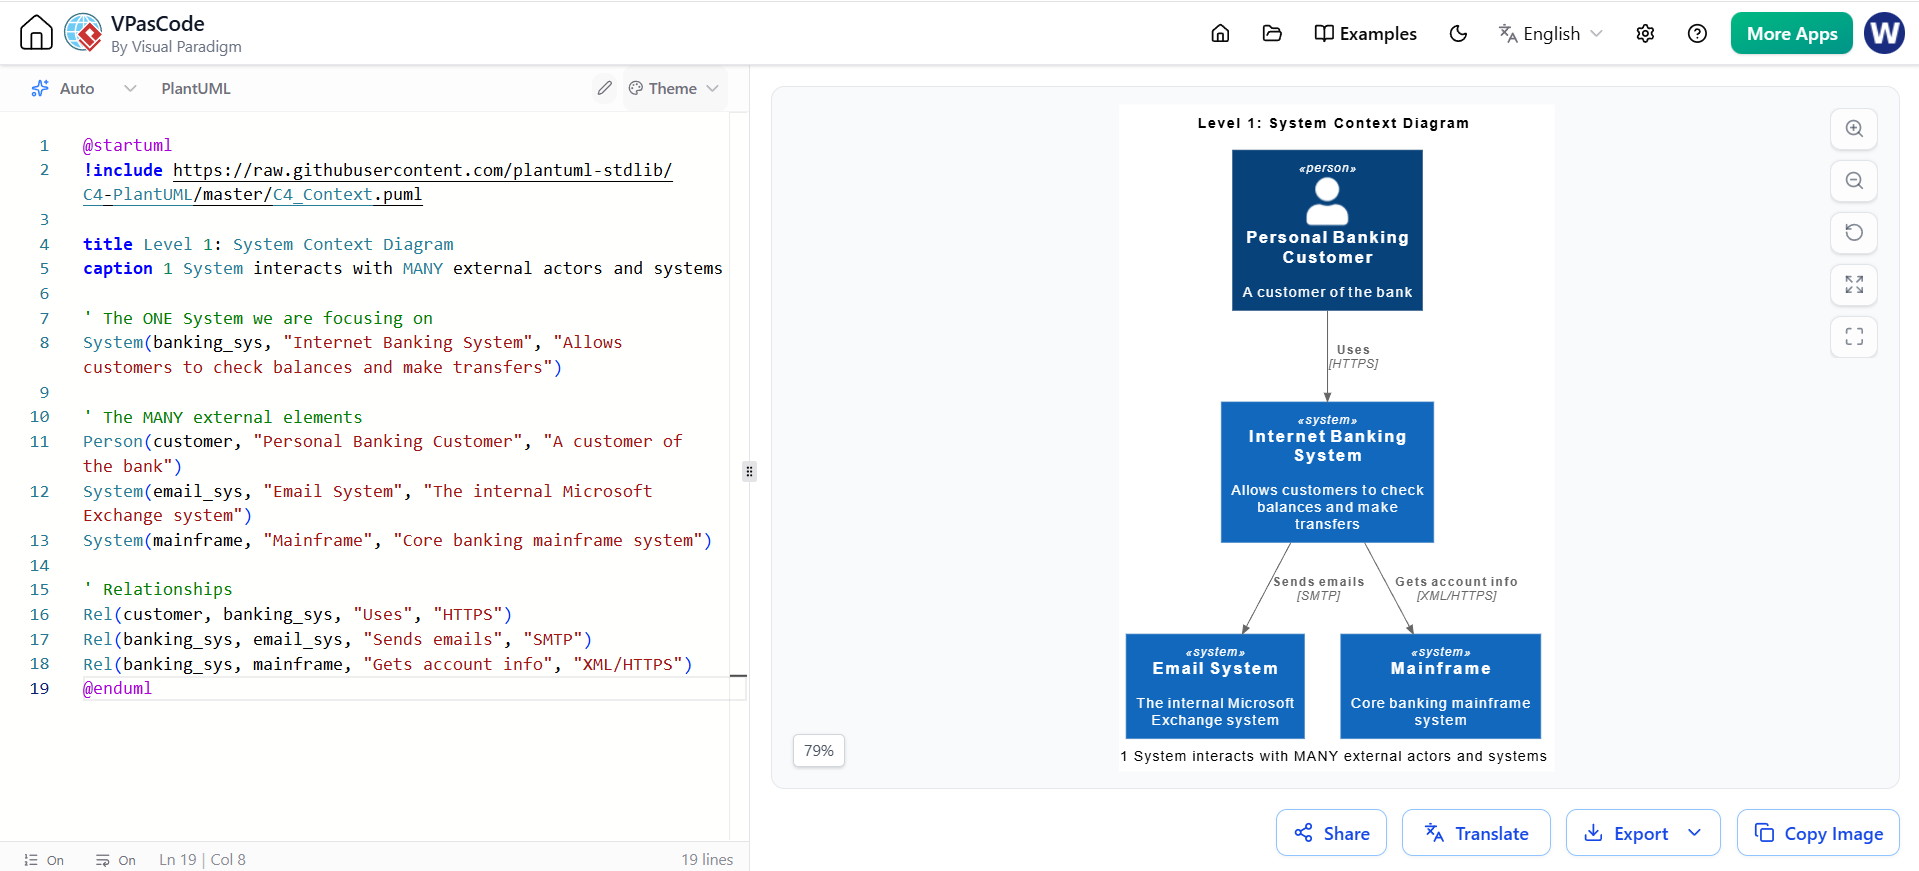
@startuml
!include https://raw.githubusercontent.com/plantuml-stdlib/C4-PlantUML/master/C4_Context.puml

title Level 1: System Context Diagram
caption 1 System interacts with MANY external actors and systems

' The ONE System we are focusing on
System(banking_sys, "Internet Banking System", "Allows customers to check balances and make transfers")

' The MANY external elements
Person(customer, "Personal Banking Customer", "A customer of the bank")
System(email_sys, "Email System", "The internal Microsoft Exchange system")
System(mainframe, "Mainframe", "Core banking mainframe system")

' Relationships
Rel(customer, banking_sys, "Uses", "HTTPS")
Rel(banking_sys, email_sys, "Sends emails", "SMTP")
Rel(banking_sys, mainframe, "Gets account info", "XML/HTTPS")
@enduml
Now, we perform our Focused Drill-Down. We select the ONE "Internet Banking System" from Level 1 and decompose it into MANY containers (web apps, databases, APIs).
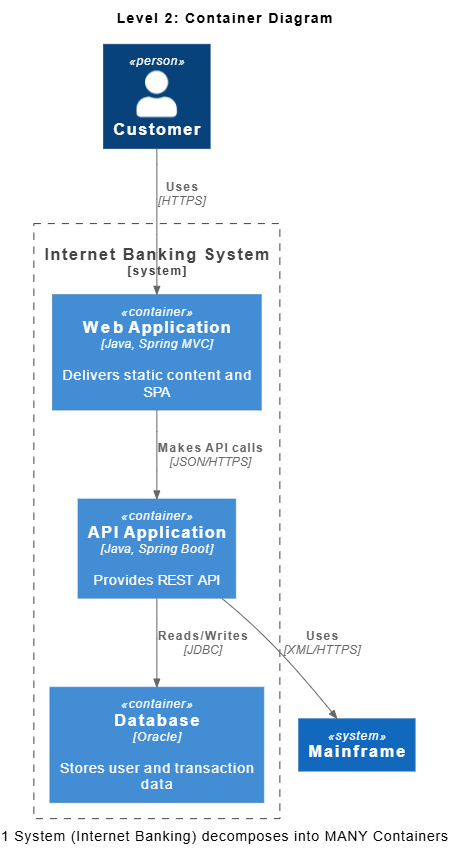
@startuml
!include https://raw.githubusercontent.com/plantuml-stdlib/C4-PlantUML/master/C4_Container.puml

title Level 2: Container Diagram
caption 1 System (Internet Banking) decomposes into MANY Containers

Person(customer, "Customer")
System(mainframe, "Mainframe")

' The ONE System boundary
System_Boundary(banking_boundary, "Internet Banking System") {
    ' The MANY containers inside
    Container(web_app, "Web Application", "Java, Spring MVC", "Delivers static content and SPA")
    Container(api_app, "API Application", "Java, Spring Boot", "Provides REST API")
    Container(db, "Database", "Oracle", "Stores user and transaction data")
}

Rel(customer, web_app, "Uses", "HTTPS")
Rel(web_app, api_app, "Makes API calls", "JSON/HTTPS")
Rel(api_app, db, "Reads/Writes", "JDBC")
Rel(api_app, mainframe, "Uses", "XML/HTTPS")
@enduml
Looking for a powerful, free diagram-as-code tool? Effortlessly render PlantUML, Mermaid, Graphviz, and 20+ programming languages in real time—powered by instant AI error fixing and automatic format detection.
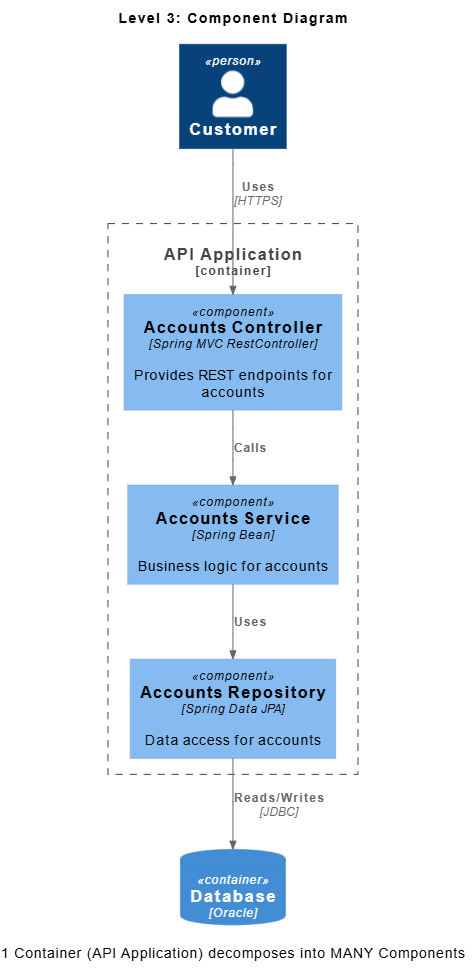
We drill down again. We select ONE container (the "API Application") and decompose it into MANY components (controllers, services, repositories).
@startuml
title Level 4: Code Diagram
caption 1 Component (Accounts Service) decomposes into MANY Code Elements

' The ONE Component boundary
package "Accounts Service" {

    ' The MANY code elements
    class "Interface\nDefines service contract" as IAccountsService
    class "Class\nImplements IAccountsService" as AccountsServiceImpl
    class "Class\nDomain model" as Account
    class "Class\nMaps DB entities to Domain models" as AccountMapper
}

' Internal code relationships
IAccountsService <-- AccountsServiceImpl : Implemented by AccountsServiceImpl --> AccountMapper : Uses
AccountsServiceImpl --> Account : Returns
@enduml
Finally, we drill down into ONE component (the "Accounts Service") to reveal the MANY code elements (classes, interfaces, methods). Note: In practice, this level is often auto-generated from code using tools like Visual Paradigm AI.
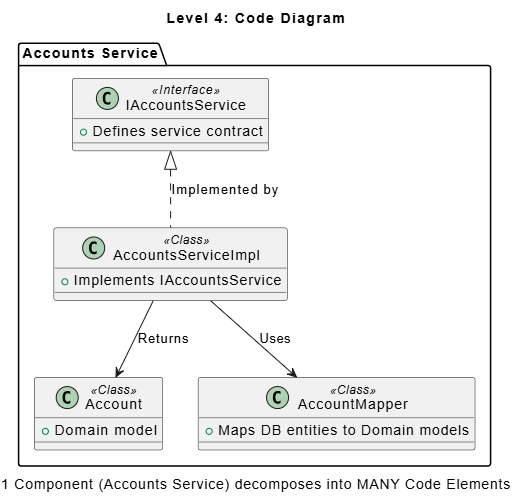
@startuml
title Level 4: Code Diagram
caption 1 Component (Accounts Service) decomposes into MANY Code Elements

' The ONE Component boundary
package "Accounts Service" {
    ' The MANY code elements
    class "IAccountsService" as IAccountsService <> {
        + Defines service contract
    }
    class "AccountsServiceImpl" as AccountsServiceImpl <> {
        + Implements IAccountsService
    }
    class "Account" as Account <> {
        + Domain model
    }
    class "AccountMapper" as AccountMapper <> {
        + Maps DB entities to Domain models
    }
}

' Internal code relationships
IAccountsService <|.. AccountsServiceImpl : Implemented by AccountsServiceImpl --> AccountMapper : Uses
AccountsServiceImpl --> Account : Returns
@enduml
When using Visual Paradigm AI and VPasCode to build these diagrams, keep the following rules in mind:
System_Boundary, Container_Boundary, and Component_Boundary in your PlantUML code to visually group the "MANY" elements inside the "ONE" parent..puml files to your repository and let OpenDocs automatically publish the updated diagrams to your team wiki every time code is merged.The C4 Model is not just a set of diagramming rules; it is a philosophy of selective decomposition. By understanding and visualizing the 1.. hierarchical relationships*, we shift our focus from creating overwhelming, monolithic architectural maps to creating clear, focused, and digestible narratives.
By combining this conceptual clarity with a modern toolchain—using Visual Paradigm AI for intelligent generation, VPasCode to keep diagrams as code, and OpenDocs for seamless publishing—you transform architectural documentation from a dreaded chore into a living, breathing asset.
Start small, pick ONE system, and let it reveal the MANY details below. Your future self, and your development team, will thank you.

