Software architecture is the blueprint that guides development, deployment, and long-term maintenance. Yet, communicating this blueprint effectively across diverse stakeholders—from business executives to frontend developers—remains a persistent challenge. The C4 Model, created by Simon Brown, bridges this communication gap by offering a lean, hierarchical, and highly readable approach to architecture documentation.
Among the four levels of the C4 hierarchy, the Container Diagram (Level 2) serves as the critical bridge between high-level system context and low-level component design. It reveals how a system is structured into independently deployable units, the technologies they leverage, and how they communicate. This guide provides a comprehensive breakdown of Container Diagram principles, practical modeling guidelines, visual best practices, and step-by-step implementation using Visual Paradigm. Whether you are documenting a legacy monolith or designing a modern microservices ecosystem, mastering this level will significantly improve architectural clarity and team alignment.
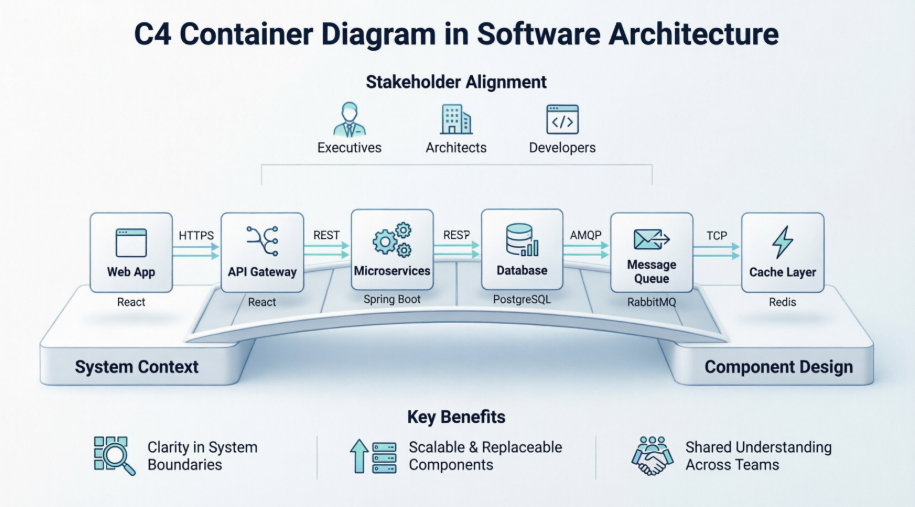
A Container in the C4 Model does not strictly refer to a Docker container or Kubernetes pod. Instead, it represents any independently deployable, runnable unit of software that typically executes a process and often manages its own data. Containers can range from web applications and mobile apps to backend services, message brokers, and databases.
Customer Application [JavaScript/Angular]Customer Service [Java/Spring Boot], Reporting Service [Ruby], Audit Service [C#/.NET]Message Bus [RabbitMQ]Customer Database [Oracle], Reporting Database [MySQL], Audit Store [Event Store]The diagram explicitly captures the protocols and intent behind each interaction, ensuring that both synchronous and asynchronous flows are documented:
HTTPS, JDBC, or JSON/HTTPS.WebSocket or RabbitMQ.Customer Service to Message Bus labeled Publishes events via RabbitMQ clarifies both the action and the medium.PlantUML Code:
@startuml "messagebus"
!include https://raw.githubusercontent.com/plantuml-stdlib/C4-PlantUML/master/C4_Container.puml
' uncomment the following line and comment the first to use locally
' !include C4_Container.puml
AddElementTag("microService", $shape=EightSidedShape(), $bgColor="CornflowerBlue", $fontColor="white", $legendText="micro service\neight sided")
AddElementTag("storage", $shape=RoundedBoxShape(), $bgColor="lightSkyBlue", $fontColor="white")
SHOW_PERSON_OUTLINE()
Person(customer, Customer, "A customer")
System_Boundary(c1, "Customer Information") {
Container(app, "Customer Application", "Javascript, Angular", "Allows customers to manage their profile")
Container(customer_service, "Customer Service", "Java, Spring Boot", "The point of access for customer information", $tags = "microService")
Container(message_bus, "Message Bus", "RabbitMQ", "Transport for business events")
Container(reporting_service, "Reporting Service", "Ruby", "Creates normalised data for reporting purposes", $tags = "microService")
Container(audit_service, "Audit Service", "C#/.NET", "Provides organisation-wide auditing facilities", $tags = "microService")
ContainerDb(customer_db, "Customer Database", "Oracle 12c", "Stores customer information", $tags = "storage")
ContainerDb(reporting_db, "Reporting Database", "MySQL", "Stores a normalized version of all business data for ad hoc reporting purposes", $tags = "storage")
Container(audit_store, "Audit Store", "Event Store", "Stores information about events that have happened", $tags = "storage")
}
Rel_D(customer, app, "Uses", "HTTPS")
Rel_D(app, customer_service, "Updates customer information using", "async, JSON/HTTPS")
Rel_U(customer_service, app, "Sends events to", "WebSocket")
Rel_U(customer_service, message_bus, "Sends customer update events to")
Rel(customer_service, customer_db, "Stores data in", "JDBC")
Rel(message_bus, reporting_service, "Sends customer update events to")
Rel(message_bus, audit_service, "Sends customer update events to")
Rel(reporting_service, reporting_db, "Stores data in")
Rel(audit_service, audit_store, "Stores events in")
Lay_R(reporting_service, audit_service)
SHOW_LEGEND()
@enduml
[RabbitMQ], [Oracle 12c], [React]). This immediate visibility helps developers, DevOps engineers, and architects quickly assess infrastructure dependencies and compatibility."Provides organization-wide auditing facilities" or "Serves customer-facing UI and handles client-side routing").Queries data via JDBC, Listens to order events).Visual Paradigm provides robust, native support for the C4 Model, enabling teams to maintain dynamic, "living" architecture documentation rather than static, decaying images.
Avoid manual shape drawing. Navigate to Diagram > New > C4 Diagrams > Container Diagram. This automatically loads the standardized C4 stencil set, ensuring compliance with notation rules for Persons, Containers, System Boundaries, and Relationships.
Visual Paradigm supports hierarchical drill-down. You can start with a System Context Diagram (Level 1) and right-click the target system to create a Sub-diagram link. This seamlessly transitions you into your Container Diagram, preserving traceability across abstraction levels.
Define containers, people, and systems in the Model Explorer first. Dragging these canonical model elements into multiple diagrams ensures a single source of truth. Updating a container's name, description, or technology in one place automatically propagates changes across all linked diagrams.
Since C4 diagrams are developer-facing tools, Visual Paradigm allows you to hyperlink containers directly to source code repositories, CI/CD pipelines, or API specifications (OpenAPI/Swagger). This integration keeps high-level architectural decisions firmly connected to the actual implementation, reducing documentation drift.
The C4 Container Diagram is more than a static drawing; it is a shared language that aligns technical teams, clarifies deployment boundaries, and exposes integration patterns early in the design process. By adhering to the principles of explicit technology labeling, clear responsibility definitions, and disciplined relationship mapping, architects can produce documentation that remains useful throughout the software lifecycle. When paired with tooling like Visual Paradigm, these diagrams evolve from deliverables into living artifacts that guide development, streamline onboarding, and support continuous architectural refinement. Embracing this structured yet lightweight approach ensures that your architecture documentation works as hard as the systems it describes.