As software systems grow increasingly complex, the challenge of communicating architecture clearly to diverse stakeholders has never been more critical. After spending several months evaluating architecture documentation tools for enterprise projects, I decided to take a deep dive into the C4 model framework and Visual Paradigm's implementation of it. What follows is my hands-on review and practical guide for teams considering this approach—not as a vendor brochure, but as a fellow architect sharing what actually works in real-world scenarios.
Whether you're presenting to executives, onboarding new developers, or aligning distributed teams, the ability to visualize architecture at the right level of detail is invaluable. This guide walks through the C4 model fundamentals, demonstrates practical PlantUML examples, and shares my experience using Visual Paradigm's ecosystem to bring these diagrams to life.
The C4 model, created by Simon Brown, offers a refreshingly pragmatic framework for visualizing software architecture. What sets it apart is its audience-focused, hierarchical structure—think of it like Google Maps for your system. You start with the "world view" and progressively zoom in to see streets, buildings, and eventually room layouts.
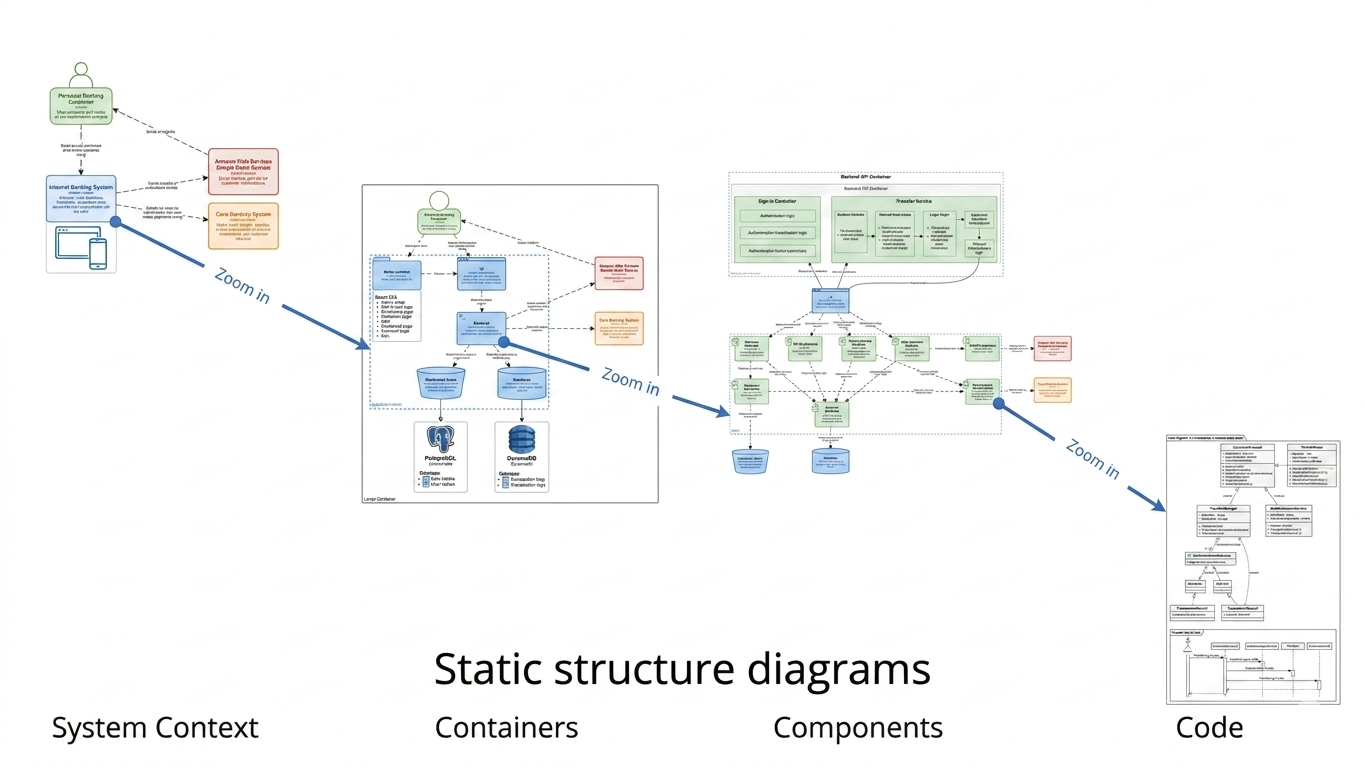
Level 1: System Context (The "10,000 ft" View)
This is your elevator pitch in diagram form. The System Context diagram treats your software as a single black box and maps its relationships with people (users) and external systems. It's perfect for non-technical stakeholders, product owners, or anyone who needs to understand scope without getting lost in technical details.
Level 2: Container Diagram (High-Level Technical Blocks)
Here we pop the hood. Containers represent independently deployable units—web applications, mobile apps, APIs, microservices, databases. This level answers "what technologies are we using and how do they talk to each other?" It's the sweet spot for engineering leads and solution architects.
Level 3: Component Diagram (Internal Structure)
Now we zoom into a single container to reveal its internal logical building blocks: controllers, services, repositories, modules. This level is invaluable for development teams during design reviews or when onboarding new engineers to a specific service.
Level 4: Code Diagram (Implementation Details)
The deepest level shows classes, interfaces, and their relationships. In practice, I've found this level most useful when auto-generated from code rather than hand-drawn. It's optional—and often unnecessary—since most teams rely on IDE navigation for this granularity.
One of the aspects I appreciate most about the C4 model is its tooling flexibility. For teams that prefer "diagrams as code," C4-PlantUML provides a powerful, version-control-friendly approach. Here's how I've implemented each level in practice.
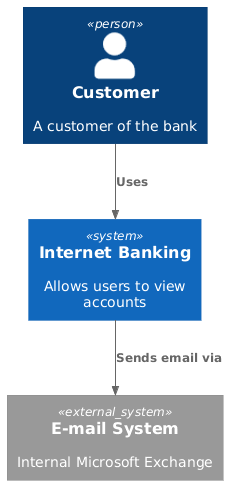
Start by defining your system boundaries and external dependencies. The syntax is intuitive and readable even for non-PlantUML veterans.
@startuml
!include https://raw.githubusercontent.com/plantuml-stdlib/C4-PlantUML/master/C4_Context.puml
Person(customer, "Customer", "A customer of the bank")
System(banking_system, "Internet Banking", "Allows users to view accounts")
System_Ext(mail_system, "E-mail System", "Internal Microsoft Exchange")
Rel(customer, banking_system, "Uses")
Rel(banking_system, mail_system, "Sends email via")
@enduml
What I like: The clear separation of internal vs. external systems using System_Ext makes dependency mapping explicit. The relationship labels ("Sends email via") add crucial context that plain arrows lack.
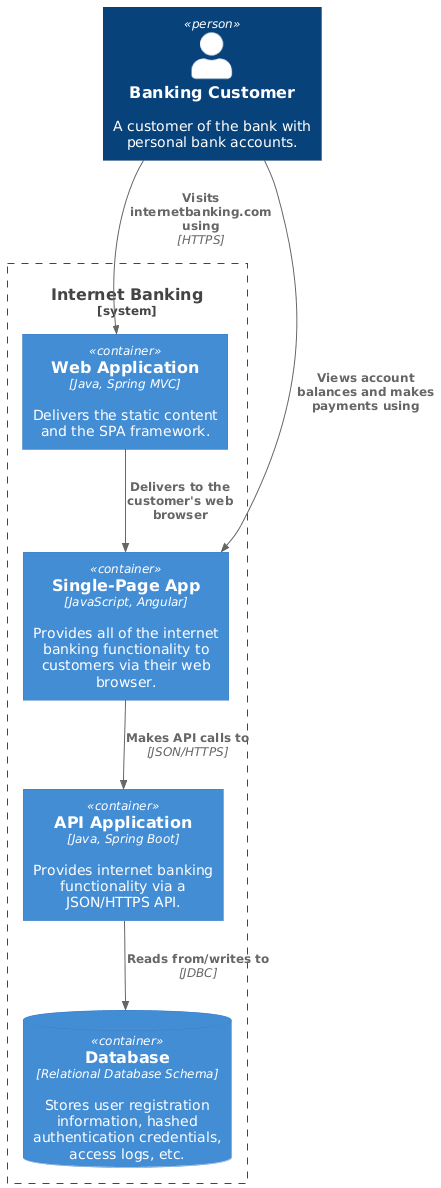
Zoom into your system to reveal deployable units and their technology stacks.
@startuml
!include https://raw.githubusercontent.com/plantuml-stdlib/C4-PlantUML/master/C4_Container.puml
Person(customer, "Banking Customer", "A customer of the bank with personal bank accounts.")
System_Boundary(c1, "Internet Banking") {
Container(web_app, "Web Application", "Java, Spring MVC", "Delivers the static content and the SPA framework.")
Container(spa, "Single-Page App", "JavaScript, Angular", "Provides all of the internet banking functionality to customers via their web browser.")
Container(api, "API Application", "Java, Spring Boot", "Provides internet banking functionality via a JSON/HTTPS API.")
ContainerDb(db, "Database", "Relational Database Schema", "Stores user registration information, hashed authentication credentials, access logs, etc.")
}
Rel(customer, web_app, "Visits internetbanking.com using", "HTTPS")
Rel(customer, spa, "Views account balances and makes payments using")
Rel(web_app, spa, "Delivers to the customer's web browser")
Rel(spa, api, "Makes API calls to", "JSON/HTTPS")
Rel(api, db, "Reads from/writes to", "JDBC")
@enduml
Pro tip: I always include the technology stack in the container description. It saves countless questions during architecture reviews and helps new team members quickly understand the tech landscape.
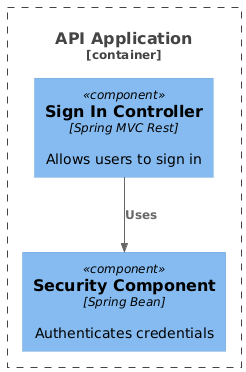
Focus on the internal structure of a single container—ideal for deep-dive technical discussions.
@startuml
!include https://raw.githubusercontent.com/plantuml-stdlib/C4-PlantUML/master/C4_Component.puml
Container_Boundary(b1, "API Application") {
Component(sign_in, "Sign In Controller", "Spring MVC Rest", "Allows users to sign in")
Component(security, "Security Component", "Spring Bean", "Authenticates credentials")
}
Rel(sign_in, security, "Uses")
@enduml
When to use this: I reserve Level 3 diagrams for complex containers or when documenting architectural decisions that need team alignment. For simple services, Level 2 often provides sufficient detail.
After implementing C4 diagrams across multiple projects, these principles have consistently delivered value:
Audience-First Design
Tailor your diagram depth to your audience. Executives need Level 1. Engineering managers benefit from Level 2. Developers diving into a service need Level 3. Don't force everyone to parse the same diagram.
Clarity Over Notation Rigidity
While the C4 model provides standard symbols, I've found that consistent labeling and clear relationship descriptions matter far more than perfect iconography. A well-labeled box beats a perfectly styled but ambiguous one.
Embrace Progressive Disclosure
Start simple. Only add Level 3 or 4 detail when complexity demands it. In my experience, 80% of stakeholder questions are answered by Levels 1 and 2.
Document Relationships Explicitly
Every arrow should have a label describing the interaction protocol or purpose ("Sends emails via [SMTP]", "Queries via [GraphQL]"). This small habit dramatically reduces ambiguity during reviews.
While PlantUML offers excellent flexibility, I also evaluated Visual Paradigm for teams seeking a more integrated, GUI-driven experience. After extensive testing, here's my balanced assessment.
Full C4 Coverage
Visual Paradigm supports all four core C4 levels plus supplemental views like System Landscape, Dynamic, and Deployment diagrams. This breadth means you can maintain a complete architecture documentation suite within a single tool.
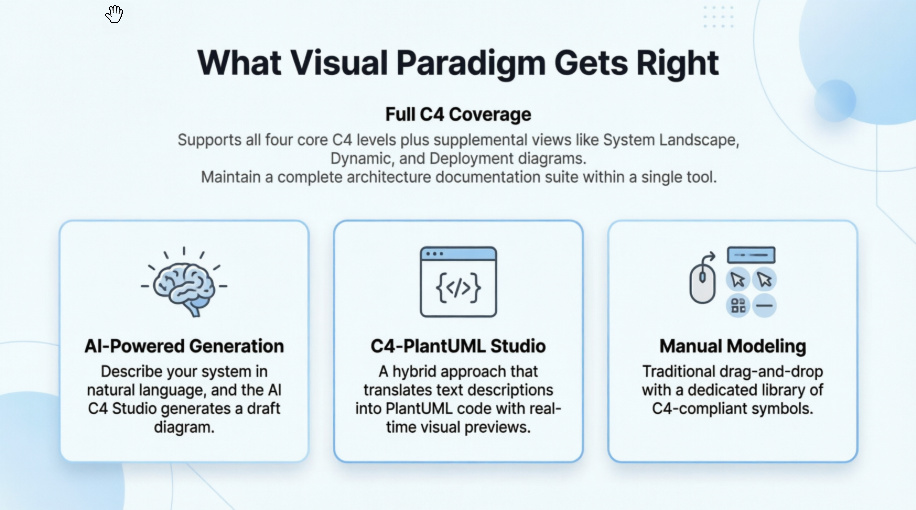
Three Creation Paths for Different Workflows
Hierarchical Navigation
One feature that genuinely improved my workflow: the ability to "drill down" from a Level 1 System Context diagram directly into its corresponding Level 2 Container diagram. This creates an explorable, interconnected model rather than isolated diagrams.
Living Documentation Integration
By exporting to PlantUML or using the Plugin API, I was able to store architecture diagrams in Git alongside source code. This ensures diagrams evolve with the system and remain accessible to the entire team.
Collaboration Features
Visual Paradigm Online supports real-time multi-user editing, commenting, and version history. For distributed teams, this eliminated the "which version is current?" confusion that plagued our previous documentation process.
UML Integration
The ability to link C4 structural views with detailed UML diagrams (Class, Sequence, etc.) bridges the gap between high-level architecture and implementation details—a capability I haven't seen executed as seamlessly elsewhere.
Many teams ask how to maintain consistency across C4 levels. Here's the workflow I've refined using Visual Paradigm:
This approach transformed our architecture reviews from static presentations into interactive explorations, significantly improving stakeholder engagement and decision quality.
The C4 model is an exceptionally effective framework for communicating software architecture, and Visual Paradigm provides one of the most comprehensive tooling ecosystems for implementing it.
Choose this approach if:
Consider alternatives if:
Ultimately, the greatest value I've observed isn't in the diagrams themselves, but in the conversations they enable. The C4 model forces clarity about boundaries, responsibilities, and interactions. Visual Paradigm amplifies this by making diagram creation, maintenance, and collaboration frictionless.
For teams serious about architecture as a communication discipline—not just a design artifact—this combination deserves serious consideration. Start small with Level 1, iterate based on feedback, and let the model's hierarchical nature guide your documentation depth. The result isn't just better diagrams; it's better-aligned teams and more maintainable systems.