In today's complex software landscape, understanding what a component does is no longer sufficient—architects and developers must also understand how it is internally constructed. While traditional UML diagrams like Class or Sequence diagrams excel at showing relationships between types or behavioral flows over time, they often treat components as opaque "black boxes." This abstraction, while useful at high levels, becomes a liability when teams need to debug intricate interactions, refactor nested dependencies, or scale internal subsystems independently.
Enter the UML Composite Structure Diagram—a powerful modeling artifact introduced in UML 2.0 that allows you to "peek inside" a classifier and visualize its internal composition. By explicitly representing parts, ports, connectors, and collaborations, this diagram bridges the critical gap between high-level architecture and low-level implementation. Whether you're designing cloud-native microservices, integrating legacy enterprise systems, or engineering resource-constrained IoT devices, Composite Structure Diagrams provide the structural clarity needed to build resilient, maintainable systems.
This comprehensive case study explores how real-world systems leverage Composite Structure Diagrams, demonstrates practical modeling patterns using Visual Paradigm, and provides actionable best practices to ensure your architectural documentation remains a living asset—not shelfware.
Before diving into case studies, it is essential to define what this diagram actually represents. Unlike a Class Diagram that shows relationships between types, a Composite Structure Diagram focuses on a single classifier and its internal makeup. It answers the question: "What is inside this component, and how do its pieces interact?"
Key elements include:
Parts: The internal instances or components that make up the whole.
Ports: Designated interaction points where parts communicate with the outside world or other internal parts.
Connectors: Links that bind ports together, defining the flow of data or control.
Interfaces: Specifications of behavior provided or required by parts.
This level of detail is crucial when a system component is not a simple monolith but a composite of smaller, collaborating units. It bridges the gap between high-level architecture and low-level implementation details.
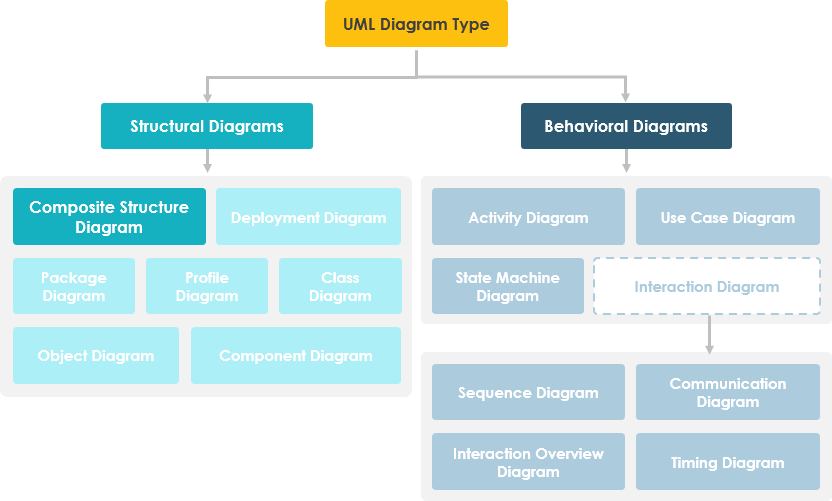
Figure 1: Where Composite Structure Diagrams fit within the UML diagram hierarchy (Source: Visual Paradigm)
To visualize the utility of this diagram, consider the standard elements used within the modeling canvas. The following table outlines the primary symbols and their semantic meaning in a technical context.
| Symbol/Element | Description | Usage Context |
|---|---|---|
| Part | Represents an internal instance of a classifier. | Used to show specific instances within a container. |
| Port | A named interaction point for a part. | Defines where connections enter or leave a part. |
| Connector | Links ports to other ports or external entities. | Establishes communication paths between parts. |
| Interface | A contract of behavior. | Specifies required or provided functionality. |
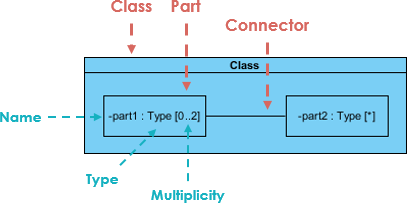
Figure 2: A simple Composite Structure Diagram showing parts, ports, and connectors (Source: Visual Paradigm)
By utilizing these elements, architects can model complex behaviors without exposing the entire codebase. It allows for abstraction where the internal logic is hidden, but the interaction mechanisms are clear.
Suppose we are modeling a system for an online store. The client has told us that customers may join a membership program which will provide them with special offers and discounted shipping, so we have extended the customer object to provide a member and standard option.
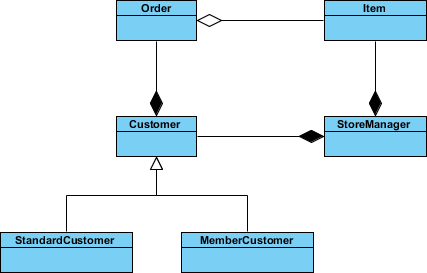
Figure 3: Class Diagram showing relationships between StoreManager, Customer, Order, and Item (Source: Visual Paradigm)
We have a class for Item which may be aggregated by the Order class, which is composed by the Customer class which itself is composed by the StoreManager class. We have a lot of objects that end up within other objects.
Everything looks like it ends up inside StoreManager, so we can create a composite structure diagram to really see what it's made of.
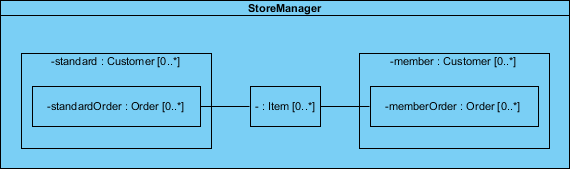
Figure 4: Composite Structure Diagram revealing internal composition of StoreManager (Source: Visual Paradigm)
In the example above, we can see:
StoreManager from its own perspective, instead of the system as a whole.
StoreManager directly contains two types of objects (Customer and Item) as is indicated by the two composition arrows on the class diagram.
The composite structure diagram here shows more explicitly is the inclusion of the subtypes of Customer.
Notice that the type of both of these parts is Customer, as the store sees both as Customer objects.
We also see a connector which shows the relation between Item and Order.
Order is not directly contained within the StoreManager class but we can show relations to parts nested within the objects it aggregates.
Question: Are two diagram below expressing the same meaning?
Answer: In a class diagram the reference between Description and Pricing is ambiguous, strictly speaking, they are not exactly the same.
The class diagram does show that Description will have a reference to a Pricing object
But it does not specify whether the reference between the two objects is contained inside the item explicitly
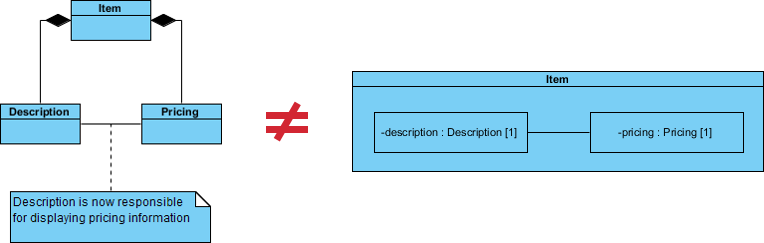
Figure 5: Class Diagram (left) vs. Composite Structure Diagram (right) – note the unambiguous containment in the latter (Source: Visual Paradigm)
If we use a Composite Structure Diagram, the meaning of the containment of the association relationship is unambiguous.
The reference between the Description and Pricing objects is contained to objects that are composed by Item.
The specific implementations of an object's activity can be clearly modeled.
We have seen examples of how Composite Structure diagrams are great at describing aggregation, but your models will also need to contain references to objects outside of the class you are modeling.
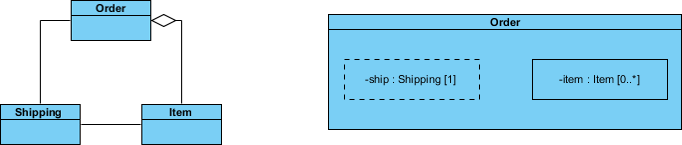
Figure 6: Modeling external references using dashed rectangles for parts (Source: Visual Paradigm)
References to external objects are shown as a part with a dashed rectangle.
Even though they reference object is outside of the class, the reference itself is within the modeled class and is an important step in showing its implementation.
A collaboration describes a structure of collaborating parts (roles). A collaboration is attached to an operation or a classifier through a Collaboration Use. You use a collaboration when you want to define only the roles and connections that are required to accomplish a specific goal of the collaboration.
For example, the goal of a collaboration can be to define the roles or the components of a classifier. By isolating the primary roles, a collaboration simplifies the structure and clarifies behavior in a model.
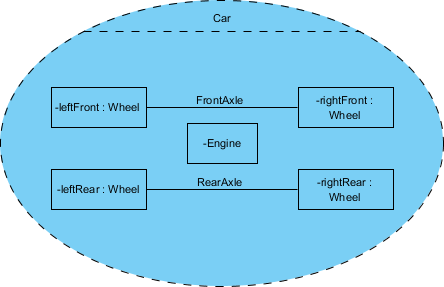
Figure 7: Car collaboration showing Wheels, Engine as Parts and FrontAxle, RearAxle as Connectors (Source: Visual Paradigm)
Parts describe the role of an instance in a classifier and can be created in the structure compartment of a classifier.
Ports define the interaction point between a classifier instance and its environment or between the behavior of the classifier and its internal parts.
Connectors represent relationships in a model, indicating links between instances of parts or ports within the same structured classifier.
Composite Structure diagrams also support the ball-and-socket notation for provided and required interfaces, which can be shown or hidden as needed.
Let's develop the composite structure diagram for a computer system which includes the following components:
Power Supply Unit (PSU)
Hard Disk Drive (HDD)
Mainboard (MB)
Optical Drive (DVD-RW)
Memory Module (MM)
We will assume for the moment that the mainboard is of the type that has a sound card and display adapter built in:
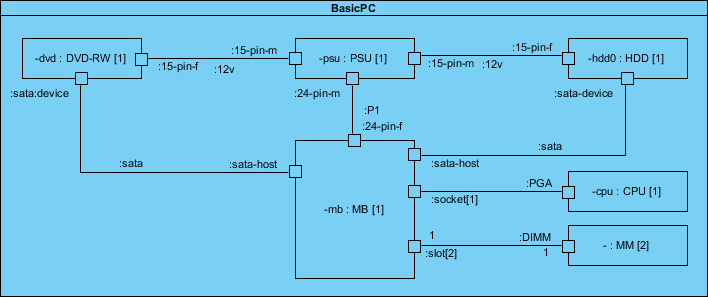
Figure 8: Composite Structure Diagram for a PC system showing internal component relationships (Source: Visual Paradigm)
This example demonstrates how physical and logical components can be modeled as parts with explicit connectors showing data and power flow pathways.
Consider a Payment Processing Service. From the outside, this is a single API endpoint. Internally, it consists of several distinct functional units:
Authentication Handler: Verifies user credentials.
Transaction Validator: Checks balance and fraud rules.
Ledger Updater: Commits changes to the database.
Notification Gateway: Sends confirmation emails.
In a Composite Structure Diagram, the Payment Service acts as the composite classifier. Inside, each of the units above is a Part. Each part exposes specific Ports.
For instance, the Transaction Validator might require an Input Port for the transaction details and provide an Output Port for the validation result. The Authentication Handler requires a user token input.
The Connectors within this diagram define the sequence of execution. Data flows from the external API into the Authentication Handler, then to the Validator, and finally to the Ledger Updater. If the Validator rejects the transaction, the flow diverges to a different port leading to an error handler.
Decoupling: Teams can work on the Notification Gateway independently as long as the port interface remains stable.
Failure Analysis: Engineers can trace exactly which internal part is failing when a service returns a 500 error.
Scalability Planning: If the Transaction Validator becomes a bottleneck, the diagram highlights it as a distinct part that can be scaled independently.
💡 Visual Paradigm Tip: Use the "Nested Composite Structure" feature to drill down into each part. Right-click a Part element → Open Specification → Composite Structure to create a dedicated sub-diagram for that component.
An enterprise needs to migrate data from a legacy database to a modern data warehouse. The integration platform acts as a mediator. It cannot speak the native protocol of the legacy system, nor can the legacy system speak the modern API protocol.
The integration component is modeled as a composite structure containing:
Protocol Translator: Converts legacy messages to JSON.
Data Mapper: Transforms field names and structures.
Queue Manager: Handles asynchronous buffering.
Security Module: Encrypts data in transit.
The diagram focuses on the Data Flow. The Protocol Translator connects to an external Required Port representing the legacy system connection. Its Provided Port connects to the Data Mapper.
This visualizes the transformation chain clearly. If the Security Module is placed between the Data Mapper and the Queue Manager, the diagram shows the encryption point explicitly. This prevents security gaps where data might be exposed in transit between internal parts.
Visibility: Stakeholders can see the transformation pipeline without reading the source code.
Testing Strategy: Testers can verify the contract at each port connection independently.
Refactoring: If the Queue Manager needs to be replaced with a different technology, the diagram confirms that only the connector and the specific part need changes, not the entire integration logic.
💡 Visual Paradigm Tip: Leverage the "Interface Realization" feature to link Ports to Interface elements. This ensures that any change to an interface automatically propagates to all implementing Ports, maintaining consistency across your model.
Consider a Smart Thermostat Device. It contains a microcontroller, temperature sensors, a Wi-Fi module, and a display screen. The software runs on top of these physical components.
The diagram models the Device Controller as the composite classifier. The internal parts are:
Sensor Driver: Software abstraction for the temperature sensor.
Connectivity Module: Handles Wi-Fi protocols.
User Interface Controller: Manages the display logic.
Power Management Unit: Optimizes battery usage.
Here, the Ports represent physical pins or logical interfaces. The Sensor Driver might have a port connected to a physical GPIO pin. The Connectivity Module has a port connected to the radio frequency hardware.
The Connectors show how data moves. For example, the Sensor Driver sends raw voltage readings to the User Interface Controller via a direct connector for local display updates. Simultaneously, it sends aggregated data to the Connectivity Module for cloud upload.
Resource Constraints: Engineers can see which parts consume the most power or memory.
Hardware Dependencies: If the hardware vendor changes the temperature sensor, the diagram shows exactly which driver part needs replacement.
Real-Time Behavior: It helps visualize latency paths. Data going through the Power Management Unit might be delayed compared to direct connections.
💡 Visual Paradigm Tip: Use the "Deployment" integration feature to link Composite Structure elements to physical nodes in a Deployment Diagram. This creates a traceable link between logical architecture and physical infrastructure.
While these diagrams are powerful, they can become overwhelming if not managed correctly. Over-modeling leads to confusion, while under-modeling misses critical details. The following guidelines ensure clarity and utility.
Do not model every single variable or method inside a part. Focus on the structural components. A part should represent a logical unit of functionality, such as a class, module, or subsystem.
Always define interfaces for ports. This decouples the internal implementation from the external contract. If the internal logic of a part changes, the port interface can remain the same, ensuring stability.
A connector without a label is ambiguous. Specify the data type, protocol, or action on the connector line. For example, label a connector as "JSON Stream" or "TCP Connection".
Ensure that parts do not depend on each other in a circular manner unless explicitly intended. Cycles can indicate design flaws or tight coupling that is hard to maintain.
Diagrams are living documents. They must be updated whenever the architecture changes. Outdated diagrams are more harmful than no diagrams at all.
💡 Visual Paradigm Tip: Enable "Model Synchronization" and "Round-Trip Engineering" features to keep your diagrams aligned with source code. Changes in code can automatically update diagram elements, and vice versa.
The Composite Structure Diagram does not exist in isolation. It complements other modeling techniques to provide a complete picture of the system.
| Diagram Type | Relationship to Composite Structure | Visual Paradigm Integration Feature |
|---|---|---|
| Class Diagram | Defines the types used for Parts. The Composite Structure Diagram instantiates these types internally. | Create Composite Structure from Class: Right-click a Class → Create Related Diagram → Composite Structure |
| Sequence Diagram | Describes the dynamic interaction between Parts over time. The Composite Structure Diagram defines the static context for this interaction. | Link to Sequence: Drag Parts from Composite Structure into a Sequence Diagram as Lifelines |
| Deployment Diagram | Shows where Parts are physically located. The Composite Structure Diagram shows how they logically interact. | Deployment Mapping: Assign Parts to Nodes using the "Deployed At" property |
| Component Diagram | Operates at a higher level. The Composite Structure Diagram can be used to drill down into a specific Component. | Nested Navigation: Double-click a Component to open its internal Composite Structure |
By combining these views, architects can trace a requirement from the high-level component down to the internal part implementation.
Even experienced modelers encounter challenges. Identifying these early prevents technical debt in the documentation.
| Pitfall | Solution | Visual Paradigm Feature |
|---|---|---|
| Too Many Parts | Group parts into sub-composites. Create a hierarchy where a main diagram references a nested composite structure. | Nested Diagrams: Create child Composite Structure diagrams and link via "Composite" property |
| Ambiguous Ports | Ensure every port has a clear interface definition. Avoid generic names like "Input" or "Output" without context. | Interface Catalog: Use the Interface Repository to manage and reuse interface definitions |
| Ignoring State | If a part has internal state that affects connectivity, document this in the part's description or use a State Machine Diagram alongside it. | Cross-Diagram Links: Link Parts to State Machine diagrams via "Behavior" property |
| Diagram Drift | Treat diagrams as code. Store them in version control systems alongside the source code. | Project Versioning: Integrate with Git/SVN via Visual Paradigm's version control plugins |
How do you know if using these diagrams adds value? Look for the following indicators:
Reduced Onboarding Time: New developers understand the internal structure faster.
Fewer Integration Bugs: Clear port definitions prevent mismatched data formats.
Better Documentation: The system documentation is more accurate and up-to-date.
Clearer Communication: Stakeholders understand the complexity of the system without needing deep technical knowledge.
The investment in modeling pays off during the maintenance phase. When a critical bug occurs, having a clear map of internal connections allows for faster diagnosis.
💡 Visual Paradigm Tip: Use the "Model Report" feature to generate documentation automatically. Export diagrams with descriptions to PDF/HTML for stakeholder reviews, ensuring everyone works from the same source of truth.
UML Composite Structure Diagrams offer a precise way to model the internal composition of software systems. They move beyond the black box view of components to reveal the machinery inside. Through the case studies of distributed microservices, enterprise integration, and embedded systems, we see that this tool is versatile across different domains.
By adhering to best practices and maintaining synchronization with the codebase—especially using powerful tooling like Visual Paradigm—teams can leverage these diagrams to build more robust, scalable, and maintainable architectures. The key is balance: enough detail to be useful, but enough abstraction to remain manageable.
As systems grow in complexity, the ability to visualize internal collaboration becomes not just a nice-to-have, but a necessity for engineering success. When approaching your next architectural design, consider the internal structure of your components. A well-drawn composite structure diagram, crafted with Visual Paradigm's intuitive interface and robust feature set, can be the difference between a fragile system and one built to endure.
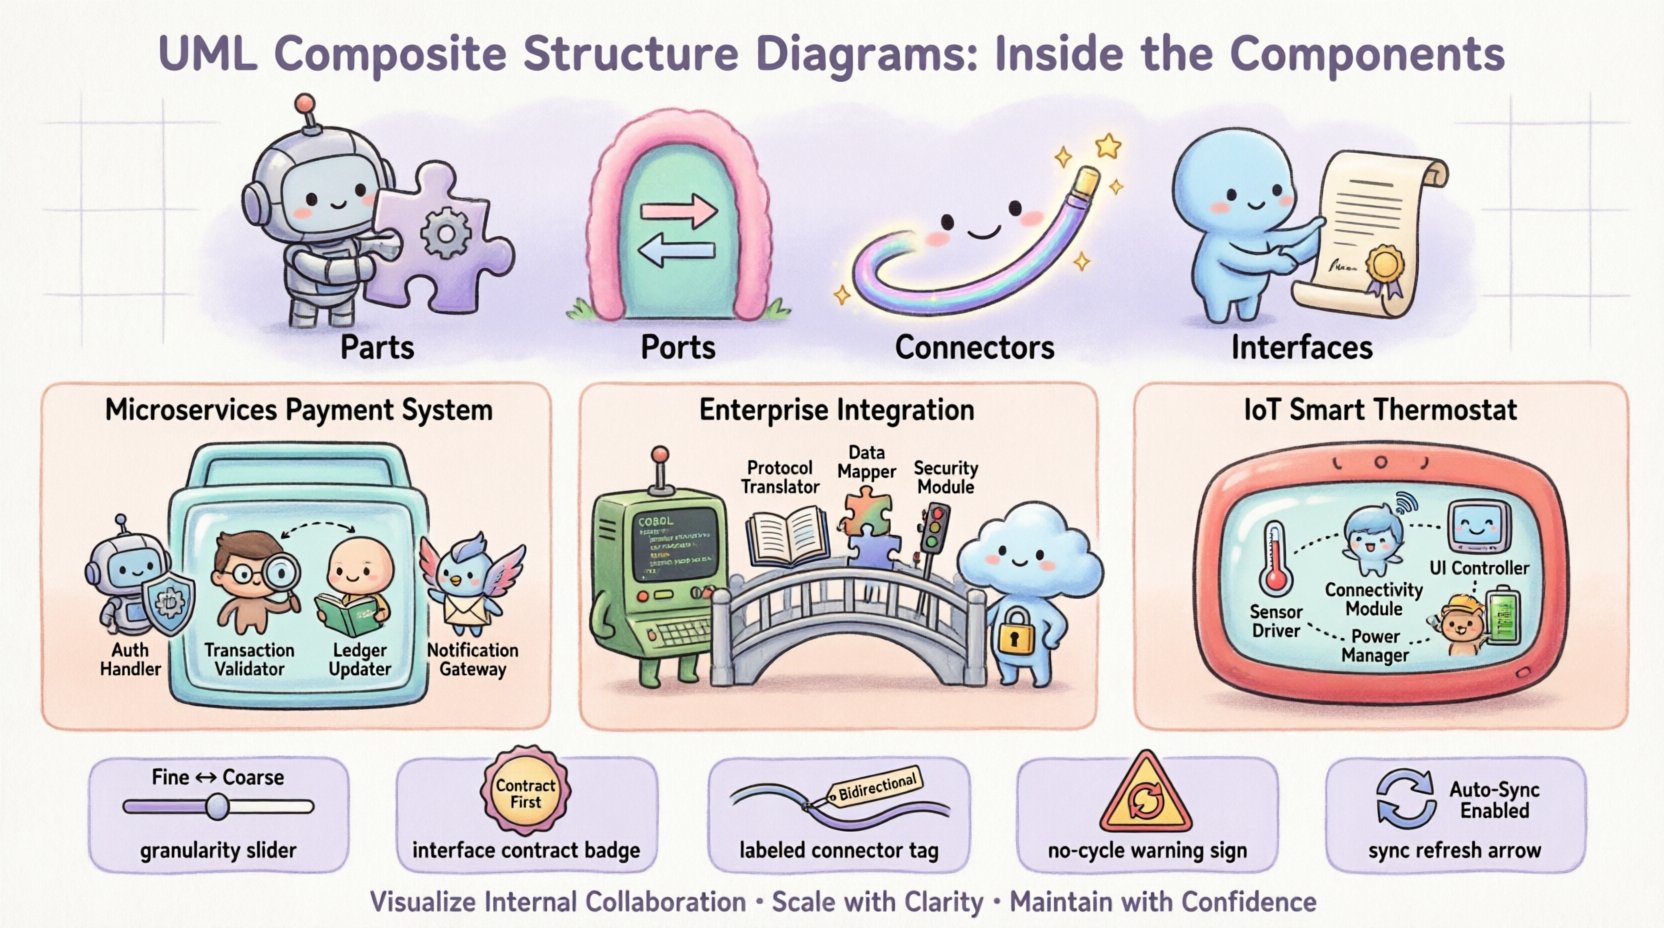
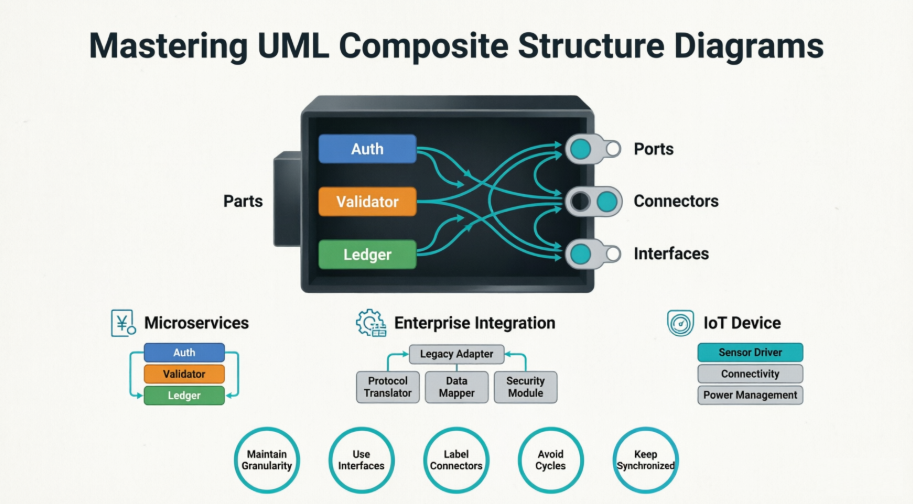
Figure 9: Visual summary of Composite Structure Diagram concepts and real-world applications (Source: AI Diagrams)
Final Thought: In an era of microservices, cloud-native architectures, and IoT ecosystems, understanding what's inside your components is no longer optional—it's essential. Start modeling your internal structures today, and build systems that are as transparent as they are powerful.
All diagrams and examples in this article were created using Visual Paradigm, the industry-leading UML modeling tool. Explore its Composite Structure Diagram features at visual-paradigm.com.