
In the realm of software engineering and systems design, visualizing the dynamic behavior of a system is just as critical as defining its static structure. UML Activity Diagrams serve as a powerful behavioral modeling tool, illustrating the flow of control and data among activities and actions associated with a particular object or set of objects.
Activity diagrams are exceptionally versatile. They are particularly useful for modeling the intricate flow of a complicated use case, mapping out a business workflow that spans multiple use cases, or detailing the step-by-step logic of a complex algorithm. Because they often capture design-level details, they are typically organized within design-level packages in a UML model.
This comprehensive guide will walk you through the fundamental building blocks, nodes, edges, and advanced structuring mechanisms of UML Activity Diagrams, complete with PlantUML code examples to bring these concepts to life.
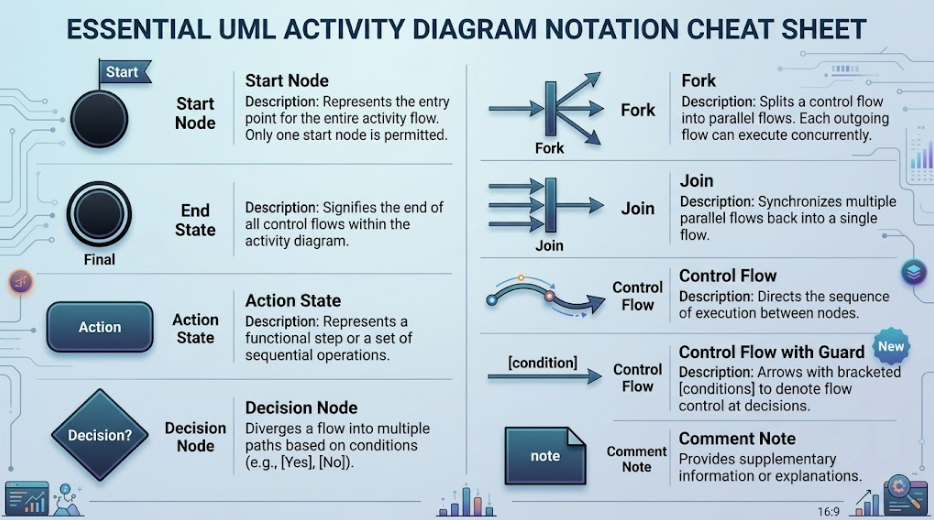
The most basic units of behavior in an activity diagram are actions and activities, driven by the flow of tokens.
Activity nodes act as placeholders for the steps within an activity. They are broadly categorized into two types: Control Nodes and Object Nodes.
Control nodes coordinate and manage the flow between other nodes in the diagram.
Object nodes provide and accept data as it flows through the activity.
«datastore» stereotype.Activity edges are the lines connecting nodes, illustrating the path of the flow.
UML 2.0+ provides several sophisticated mechanisms to organize complex activity logic and make diagrams more readable.
| Concept | UML Shape / Notation | Purpose |
|---|---|---|
| Action | Rounded Rectangle | Lowest level executable primitive function. |
| Initial Node | Solid Black Circle | Starting point of the activity flow. |
| Activity Final | Bull's-eye (Circle in Circle) | Terminates all flows and the entire activity. |
| Decision Node | Diamond | Splits flow based on Boolean guard conditions. |
| Fork / Join | Long Thin Black Rectangle | Splits flow into parallel paths / Synchronizes parallel paths. |
| Data Store | Rectangle with «datastore» |
Represents persistent data storage. |
| Swimlanes | Vertical / Horizontal Lines | Groups actions by responsible department or system. |
Below are practical examples of how to translate these concepts into PlantUML code. You can copy and paste these blocks into any PlantUML renderer (like the PlantUML Web Server, VS Code extensions, or IntelliJ plugins) to generate the visual diagrams.
This example demonstrates the context mentioned in the introduction, utilizing Swimlanes, Fork/Join nodes for parallel processing, and Decision nodes for conditional logic.
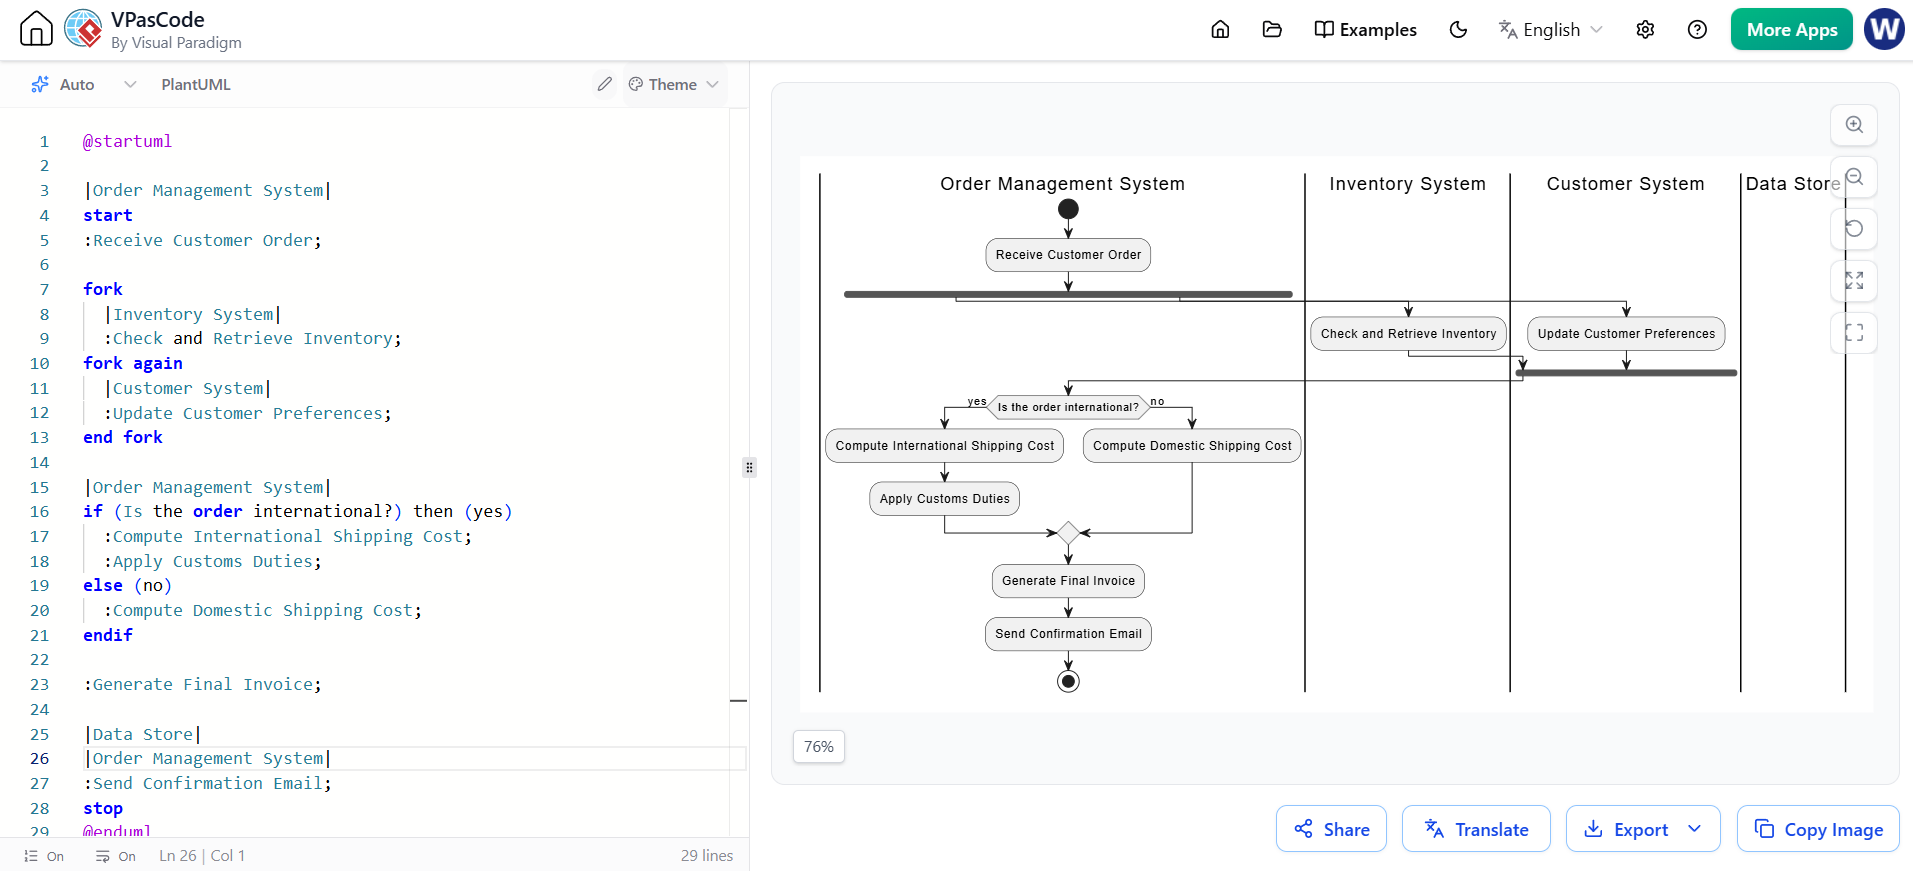
@startuml

|Order Management System|
start
:Receive Customer Order;

fork
  |Inventory System|
  :Check and Retrieve Inventory;
fork again
  |Customer System|
  :Update Customer Preferences;
end fork

|Order Management System|
if (Is the order international?) then (yes)
  :Compute International Shipping Cost;
  :Apply Customs Duties;
else (no)
  :Compute Domestic Shipping Cost;
endif

:Generate Final Invoice;

|Data Store|

|Order Management System|
:Send Confirmation Email;
stop
@enduml
This example illustrates a more technical algorithmic flow, highlighting Loop Nodes (using repeat), Object Flows (passing data variables), and Data Store interactions.
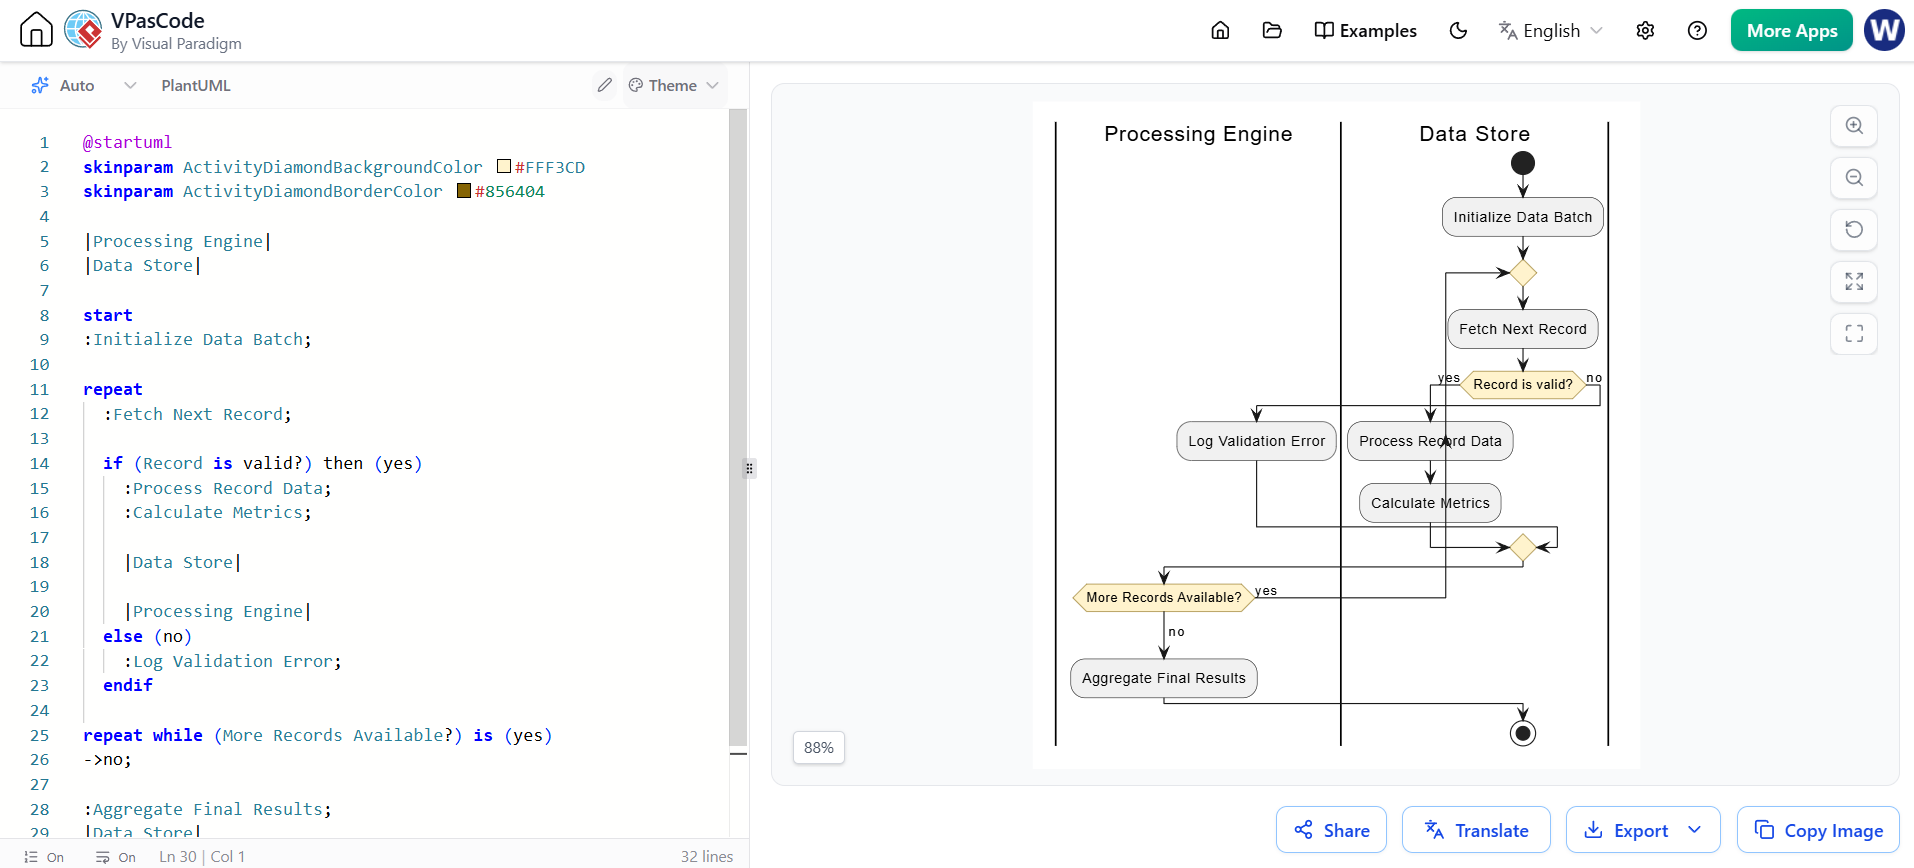
@startuml
skinparam ActivityDiamondBackgroundColor #FFF3CD
skinparam ActivityDiamondBorderColor #856404

|Processing Engine|
|Data Store|

start
:Initialize Data Batch;

repeat
  :Fetch Next Record;

  if (Record is valid?) then (yes)
    :Process Record Data;
    :Calculate Metrics;

    |Data Store|
    :Write Metrics to Buffer;
    |Processing Engine|
  else (no)
    :Log Validation Error;
  endif

repeat while (More Records Available?) is (yes)
->no;

:Aggregate Final Results;
|Data Store|
:Commit to Data Store;
stop
@endumlUML Activity Diagrams are an indispensable tool in the software engineer's and business analyst's toolkit. By bridging the gap between high-level requirements and low-level design, they provide a clear, visual narrative of how a system behaves, how data moves, and how control flows through complex algorithms and business workflows.
Mastering the fundamental building blocks—actions, activities, and tokens—along with the precise use of control nodes, object nodes, and advanced structuring like swimlanes, allows you to create diagrams that are not only technically accurate but also highly communicative. Whether you are mapping out a simple user login flow or orchestrating a massive, multi-departmental enterprise workflow, activity diagrams ensure that your system's dynamic behavior is thoroughly understood by all stakeholders before a single line of code is written.

