
In the realm of software engineering and systems design, visualizing the dynamic behavior of a system is just as critical as defining its static structure. Enter the Activity Diagram, a powerful behavioral diagram in the Unified Modeling Language (UML).
An activity diagram illustrates the flow of control and data among activities and actions associated with a particular object or set of objects. They are the go-to tool for modeling the flow of a complicated use case, illustrating a business workflow across multiple use cases, or detailing the step-by-step logic of an algorithm. Because they often capture design-level details and operational logic, activity diagrams are frequently placed in design-level packages within a system's architecture.
This comprehensive guide will break down the core components, activity nodes, and grouping mechanisms of activity diagrams, providing you with the knowledge and practical PlantUML examples needed to model complex workflows effectively.
The foundation of any activity diagram is built upon three primary elements: Actions, Activities, and Edges.
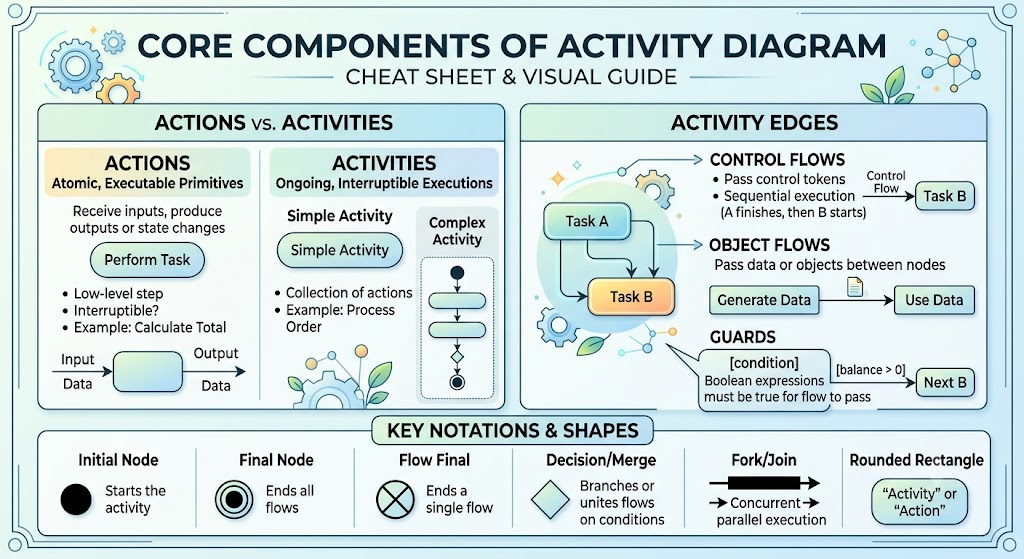
While often used interchangeably in casual conversation, UML makes a distinct separation between the two:
Actions: These are the atomic, executable primitive assignments or computations. They receive input values and produce a change of state or output values. In a diagram, they are represented by rectangles with rounded corners.
Activities: An activity is a broader, ongoing, and interruptible execution of a series of actions.
Simple activities use the exact same rounded rectangle shape as actions.
Complex activities are represented by a bordered area that encapsulates its own internal nodes and edges, allowing for nested behavioral modeling.
Edges are the connective tissue of the diagram, showing the flow of control or data between nodes.
Control Flows: Pass control tokens, indicating that one action has finished and the next can begin.
Object Flows: Pass actual objects or data from one node to another.
Guards: Edges can be annotated with guards, which are Boolean expressions enclosed in brackets (e.g., [balance > 0]). The flow will only traverse the edge if the guard evaluates to true.
Nodes are the specific points in the diagram where the flow is initiated, terminated, directed, or manipulated. They are broadly categorized into Control Nodes and Object Nodes.
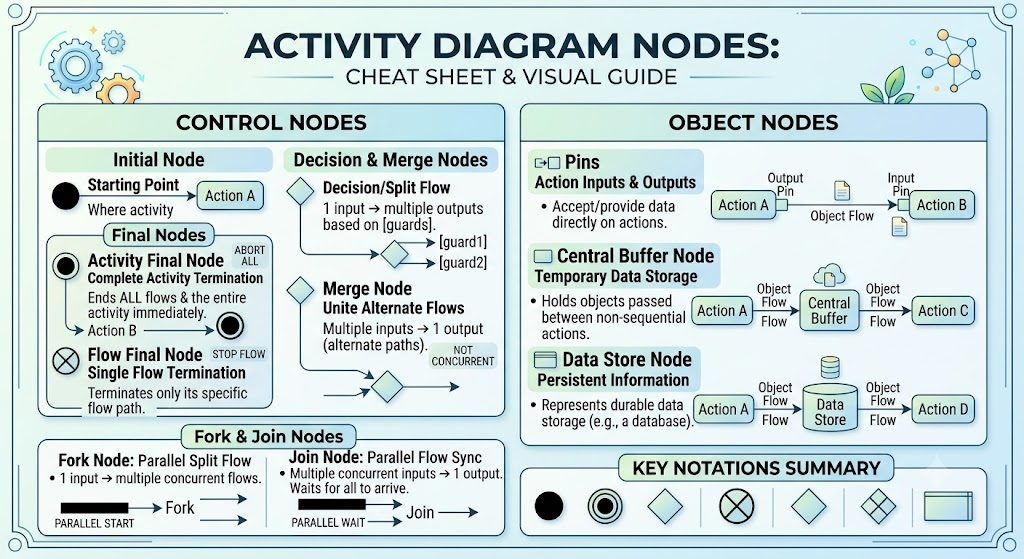
These nodes coordinate the flow of control between other nodes:
Initial Node: The starting point of the flow (represented by a solid black circle).
Final Nodes: There are two critical types:
Flow Final Node: Terminates a single, specific flow of control (represented by a circle with an inner black circle and an X).
Activity Final Node: Terminates all flows and the entire activity itself immediately (represented by a solid black circle surrounded by a hollow circle).
Decision and Merge Nodes: Both are depicted as diamonds.
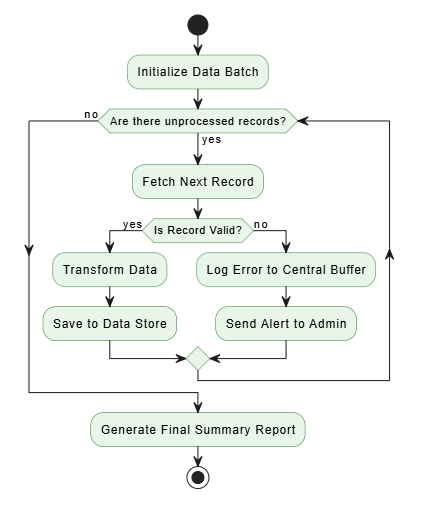
A Decision Node takes one incoming flow and splits it into multiple outgoing paths based on guard conditions.
A Merge Node brings multiple alternate, mutually exclusive flows back together into a single outgoing path.
Fork and Join Nodes: Represented as long, thin black rectangles (bars).
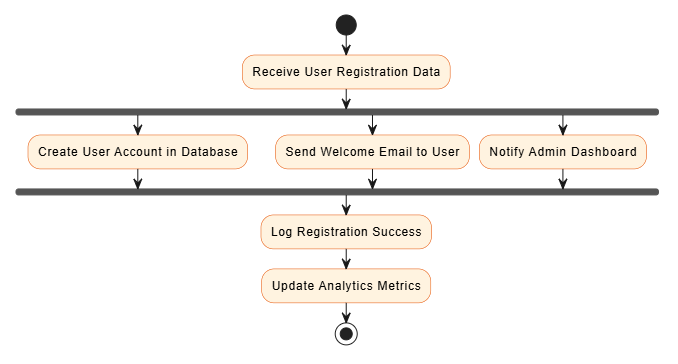
A Fork Node splits a single flow into multiple concurrent (parallel) flows.
A Join Node synchronizes multiple concurrent flows back into a single flow, waiting for all incoming flows to complete before proceeding.
These nodes provide and accept objects and data as they flow into and out of behaviors:
Pins: Specific inputs and outputs attached directly to actions.
Central Buffer Nodes: Temporary storage for objects being passed between actions.
Data Store Nodes: Represent persistent information (like a database) where data is stored and retrieved.
To manage complexity and organize large behaviors, UML provides several structural grouping mechanisms.
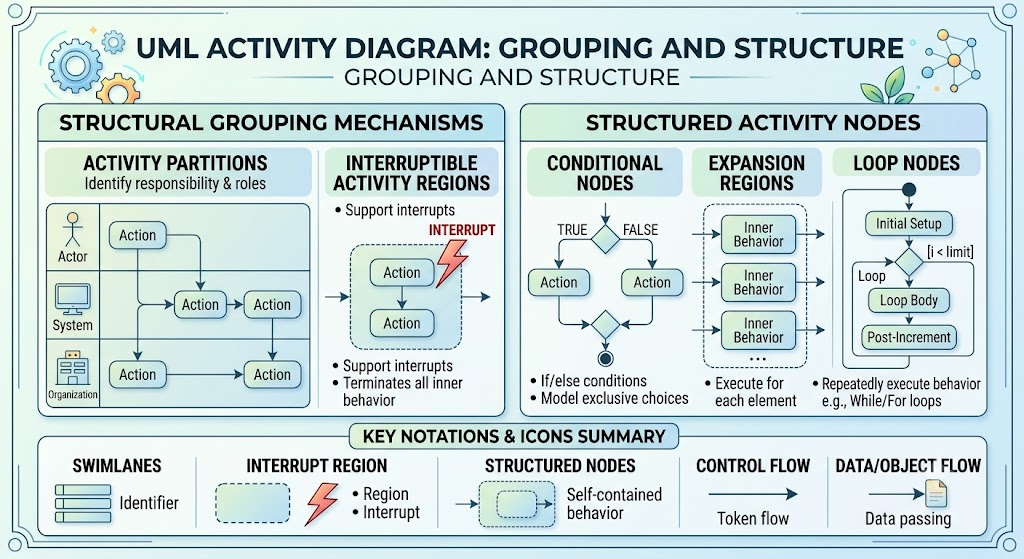
Activity Partitions (Swimlanes): These are pairs of parallel vertical or horizontal lines used to group actions that share a common characteristic. Most commonly, they identify which part of an organization, system, or actor performs a specific set of actions.
Interruptible Activity Regions: Represented by a dashed, round-cornered rectangle. These regions support interrupts; if an interrupt occurs (often depicted with a "lightning bolt" edge), it immediately terminates all behaviors currently executing inside the region.
Structured Activity Nodes: These represent structured portions of an activity that are self-contained and not shared with other nodes. Key types include:
Conditional Nodes: For modeling exclusive choices (similar to if/else statements).
Expansion Regions: Execute their internal behavior once for each element in an incoming collection.
Loop Nodes: Execute a section of the activity repeatedly based on a condition (similar to while or for loops).
Below are three comprehensive examples demonstrating how to translate these concepts into visual diagrams using PlantUML (using the modern "new" activity syntax).
This example models an e-commerce order fulfillment process, utilizing swimlanes to separate responsibilities and decision nodes to handle logic branching.
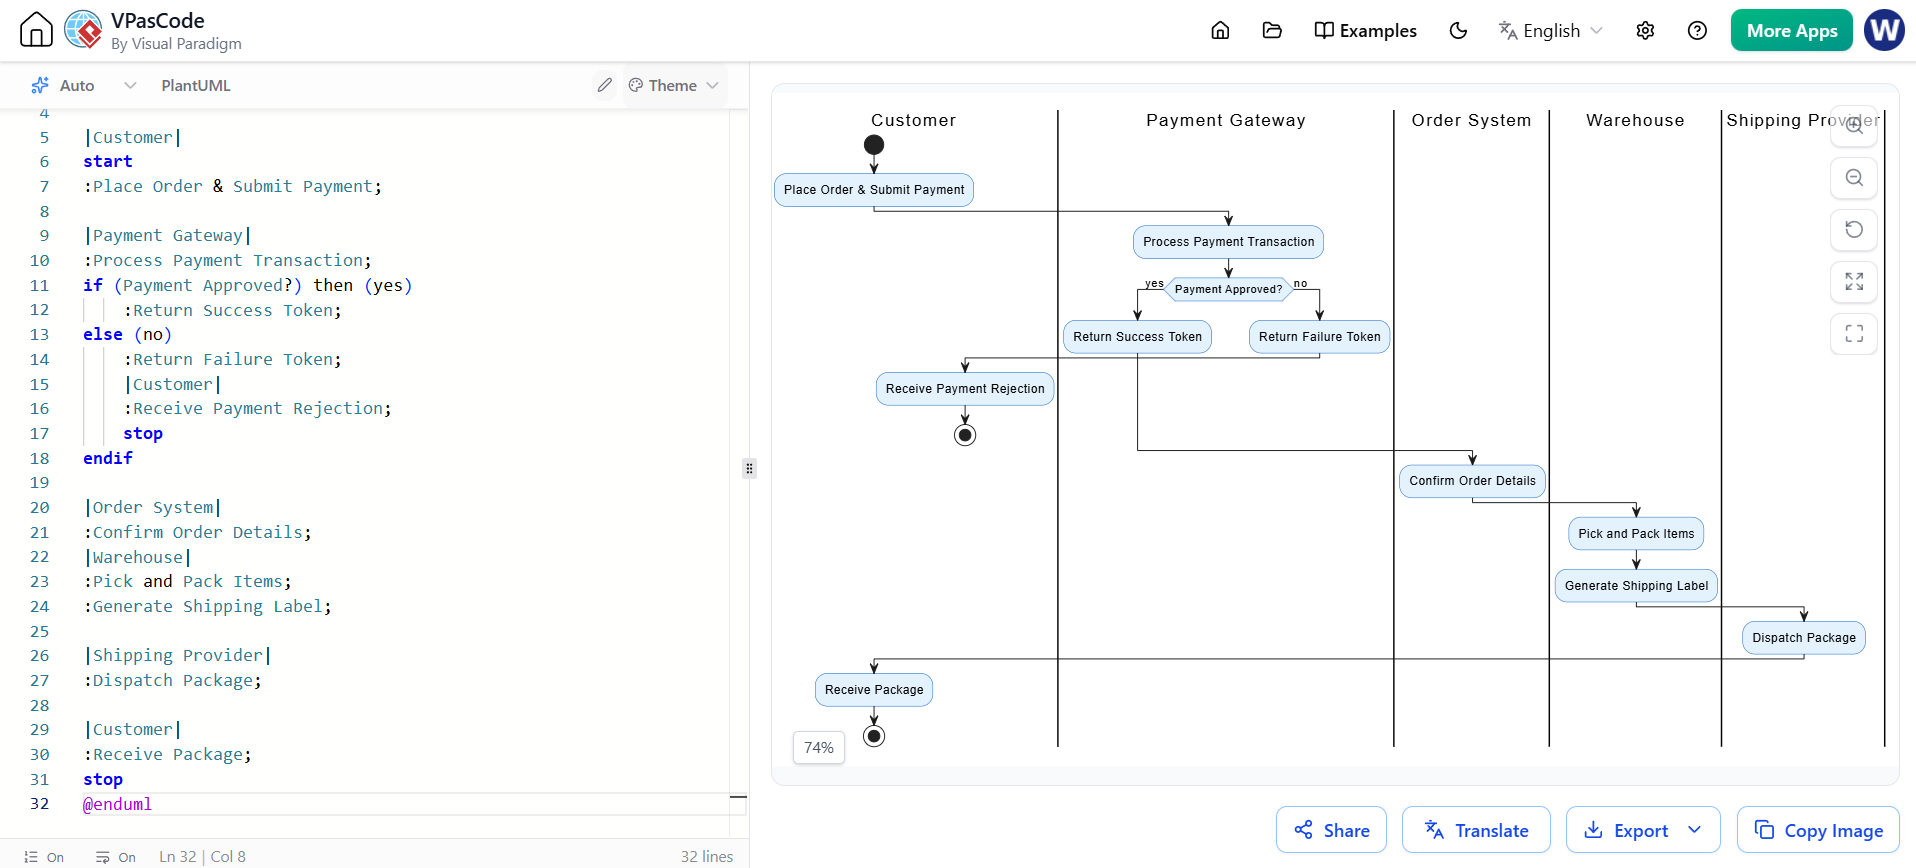
@startuml
skinparam ActivityBackgroundColor #E3F2FD
skinparam ActivityBorderColor #1565C0

|Customer|
start
:Place Order & Submit Payment;

|Payment Gateway|
:Process Payment Transaction;
if (Payment Approved?) then (yes)
    :Return Success Token;
else (no)
    :Return Failure Token;
    |Customer|
    :Receive Payment Rejection;
    stop
endif

|Order System|
:Confirm Order Details;
|Warehouse|
:Pick and Pack Items;
:Generate Shipping Label;

|Shipping Provider|
:Dispatch Package;

|Customer|
:Receive Package;
stop
@enduml
This example demonstrates how to model parallel execution. When a user registers, the system must perform three independent tasks simultaneously before finalizing the process.
@startuml
skinparam ActivityBackgroundColor #FFF3E0
skinparam ActivityBorderColor #E65100

start
:Receive User Registration Data;

fork
    :Create User Account in Database;
fork again
    :Send Welcome Email to User;
fork again
    :Notify Admin Dashboard;
end fork

:Log Registration Success;
:Update Analytics Metrics;
stop
@enduml
This example illustrates a batch data processing algorithm using a loop node (while loop) and conditional logic inside the iteration.
@startuml
skinparam ActivityBackgroundColor #E8F5E9
skinparam ActivityBorderColor #2E7D32

start
:Initialize Data Batch;

while (Are there unprocessed records?) is (yes)
    :Fetch Next Record;

    if (Is Record Valid?) then (yes)
        :Transform Data;
        :Save to Data Store;
    else (no)
        :Log Error to Central Buffer;
        :Send Alert to Admin;
    endif
endwhile (no)

:Generate Final Summary Report;
stop
@enduml
Keep it Readable: If an activity diagram becomes too large, break it down. Use complex activities (nested diagrams) or separate diagrams for sub-workflows.
Use Swimlanes Wisely: Swimlanes are excellent for business workflows involving multiple actors or departments, but they can clutter diagrams focused purely on internal algorithmic logic.
Don't Overuse Fork/Join: Concurrency makes diagrams hard to read. Only use fork and join nodes when parallel execution is a strict requirement of the system design.
Define Guards Clearly: Ensure all guards on decision nodes are mutually exclusive and collectively exhaustive to prevent "dead ends" in your logic flow.
Activity diagrams are an indispensable tool in the UML toolkit for modeling the dynamic, operational aspects of a system. By clearly defining actions, coordinating flows with specialized nodes, and organizing complex logic through swimlanes and structured regions, they bridge the gap between high-level business requirements and low-level algorithmic implementation.
Whether you are mapping out a multi-department business process, designing a concurrent software architecture, or detailing the logic of a complex algorithm, mastering the components of the activity diagram will significantly enhance your system design and communication capabilities. By leveraging tools like PlantUML, you can easily translate these concepts into clear, maintainable, and version-controlled visual models.

