Despite the rise of AI coding assistants, low-code platforms, and agile methodologies, UML (Unified Modeling Language) remains one of the most powerful tools for thinking clearly, communicating designs, and building maintainable systems.
In 2025, UML is not about rigid documentation — it’s about visual thinking and effective collaboration. Top engineering teams at companies like Google, Netflix, and Stripe still use UML (or UML-inspired diagrams) to align stakeholders, reduce ambiguity, and catch design flaws early.
This guide focuses on the 7 most essential UML diagrams every developer and software architect should master. You’ll learn what each diagram is for, when to use it, key notations, and practical tips.
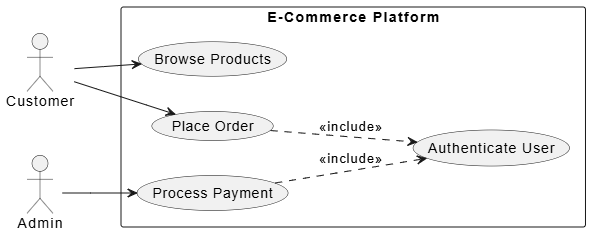
Purpose: Captures functional requirements by showing how actors interact with the system.
When to Use:
Early requirements gathering
Stakeholder discussions
Defining system scope
Key Elements:
Actor (stick figure) – user or external system
Use Case (oval) – a goal or functionality
System Boundary (rectangle)
Relationships: <<include>>, <<extend>>, generalization
Example:
An e-commerce platform might have actors like Customer, Admin, and use cases such as Browse Products, Place Order, Process Payment (with <<include>> for Authenticate User).
@startuml
left to right direction

actor "Customer" as customer
actor "Admin" as admin

rectangle "E-Commerce Platform" {
usecase "Browse Products" as UC_Browse
usecase "Place Order" as UC_Order
usecase "Process Payment" as UC_Payment
usecase "Authenticate User" as UC_Auth
}

customer --> UC_Browse
customer --> UC_Order

admin --> UC_Payment

UC_Order ..> UC_Auth : <<include>>
UC_Payment ..> UC_Auth : <<include>>

@endumlPro Tip: Keep use cases at a consistent level of granularity. Avoid technical details here.
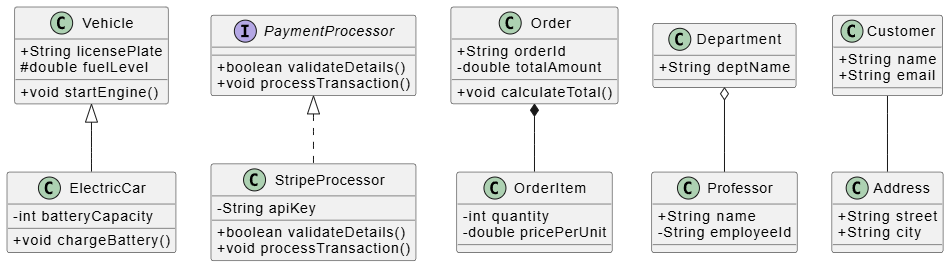
Purpose: Shows the static structure of the system — classes, attributes, operations, and relationships.
When to Use:
Designing domain models
Database schema planning
Refactoring legacy code
Key Notations:
Class: +public, -private, #protected attributes and methods
Relationships:
Association (solid line)
Aggregation (hollow diamond)
Composition (filled diamond)
Inheritance (solid line with hollow arrow)
Realization (dashed line with hollow arrow)
This class diagram illustrates the core building blocks and relationships used in object-oriented design:
Public (+): Accessible from anywhere (e.g., +startEngine()).
Private (-): Hidden inside the class (e.g., -batteryCapacity).
Protected (#): Accessible by the class and its subclasses (e.g., #fuelLevel).
Inheritance (<|--): ElectricCar is a specific type of Vehicle, inheriting its traits.
Realization (<|..): StripeProcessor implements the rules defined by the PaymentProcessor interface.
Composition (*--): A strong "owns" relationship. An OrderItem cannot exist without its parent Order.
Aggregation (o--): A loose "has" relationship. A Department contains a Professor, but the professor can exist independently if the department closes.
Association (--): A basic connection. A Customer is simply linked to an Address.
PlantUML Class Diagram Code:
@startuml

skinparam classAttributeIconSize 0

' Inheritance Example

class Vehicle {

    + String licensePlate

    # double fuelLevel

    + void startEngine()

}

class ElectricCar {

    - int batteryCapacity

    + void chargeBattery()

}

Vehicle <|-- ElectricCar

' Realization Example

interface PaymentProcessor {

    + boolean validateDetails()

    + void processTransaction()

}

class StripeProcessor {

    - String apiKey

    + boolean validateDetails()

    + void processTransaction()

}

PaymentProcessor <|.. StripeProcessor

' Composition Example (Order completely owns OrderItem)

class Order {

    + String orderId

    - double totalAmount

    + void calculateTotal()

}

class OrderItem {

    - int quantity

    - double pricePerUnit

}

Order *-- OrderItem

' Aggregation Example (Department has Professors, but they exist independently)

class Department {

    + String deptName

}

class Professor {

    + String name

    - String employeeId

}

Department o-- Professor

' Association Example (Customer and Address are connected)

class Customer {

    + String name

    + String email

}

class Address {

    + String street

    + String city

}

Customer -- Address

@endumlBest Practice: Apply the “3C” rule — keep classes Cohesive, Coupled appropriately, and Consistent in naming.
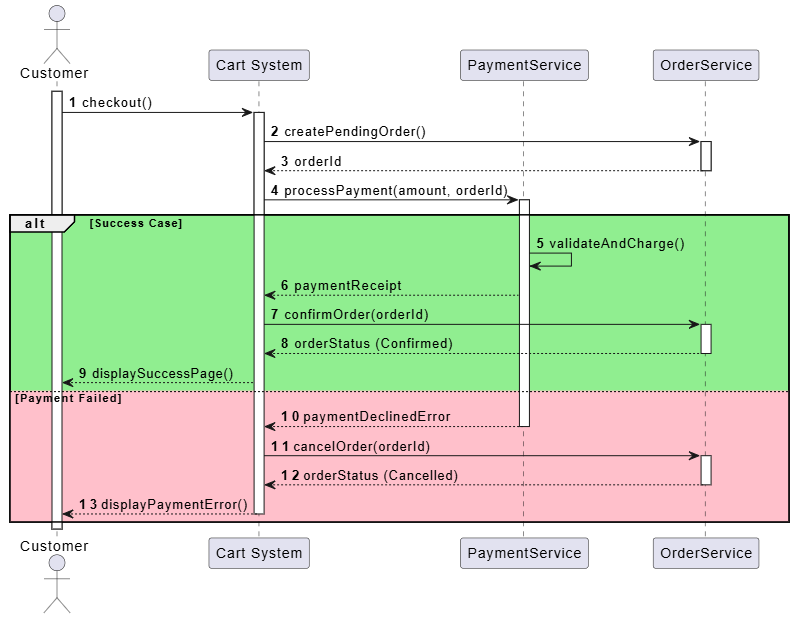
Purpose: Shows how objects interact in a specific scenario, emphasizing the order of messages.
When to Use:
Complex user flows
API design and integration
Understanding concurrency and lifecycles
Key Elements:
Lifelines (vertical dashed lines)
Messages (horizontal arrows): synchronous, asynchronous, return
Activation bars
Fragments: alt, opt, loop, par
Example: Checkout flow — Customer → Cart → PaymentService → OrderService.
This sequence diagram illustrates a standard e-commerce checkout workflow, emphasizing the chronological order of operations and conditional logic:
Lifelines & Activations: Vertical dashed lines represent the lifespan of each component (Customer, Cart, PaymentService, OrderService). The vertical rectangles highlight when a specific component is actively processing a request.
Synchronous Messages: Solid horizontal arrows (e.g., checkout(), processPayment()) show method calls where the sender waits for a response. Dashed arrows show the returned data.
Alt Fragment (Conditional Logic): The alt block splits the timeline into two mutually exclusive paths based on the payment outcome:
Success Case: The payment succeeds, the order status changes to "Confirmed," and the customer sees a success screen.
Payment Failed: The payment declines, the order is cancelled, and the customer receives an error message to retry.
@startuml
autonumber
skinparam ParticipantPadding 20
skinparam BoxPadding 10

actor "Customer" as customer
participant "Cart System" as cart
participant "PaymentService" as payment
participant "OrderService" as order

activate customer

customer -> cart : checkout()
activate cart

cart -> order : createPendingOrder()
activate order
order --> cart : orderId
deactivate order

cart -> payment : processPayment(amount, orderId)
activate payment

alt #LightGreen Success Case
payment -> payment : validateAndCharge()
payment --> cart : paymentReceipt

cart -> order : confirmOrder(orderId)
activate order
order --> cart : orderStatus (Confirmed)
deactivate order

cart --> customer : displaySuccessPage()

else #Pink Payment Failed
payment --> cart : paymentDeclinedError
deactivate payment

cart -> order : cancelOrder(orderId)
activate order
order --> cart : orderStatus (Cancelled)
deactivate order

cart --> customer : displayPaymentError()
deactivate cart
end

deactivate customer
@enduml2025 Tip: Use sequence diagrams to document critical paths before implementing with async patterns or event-driven architectures.
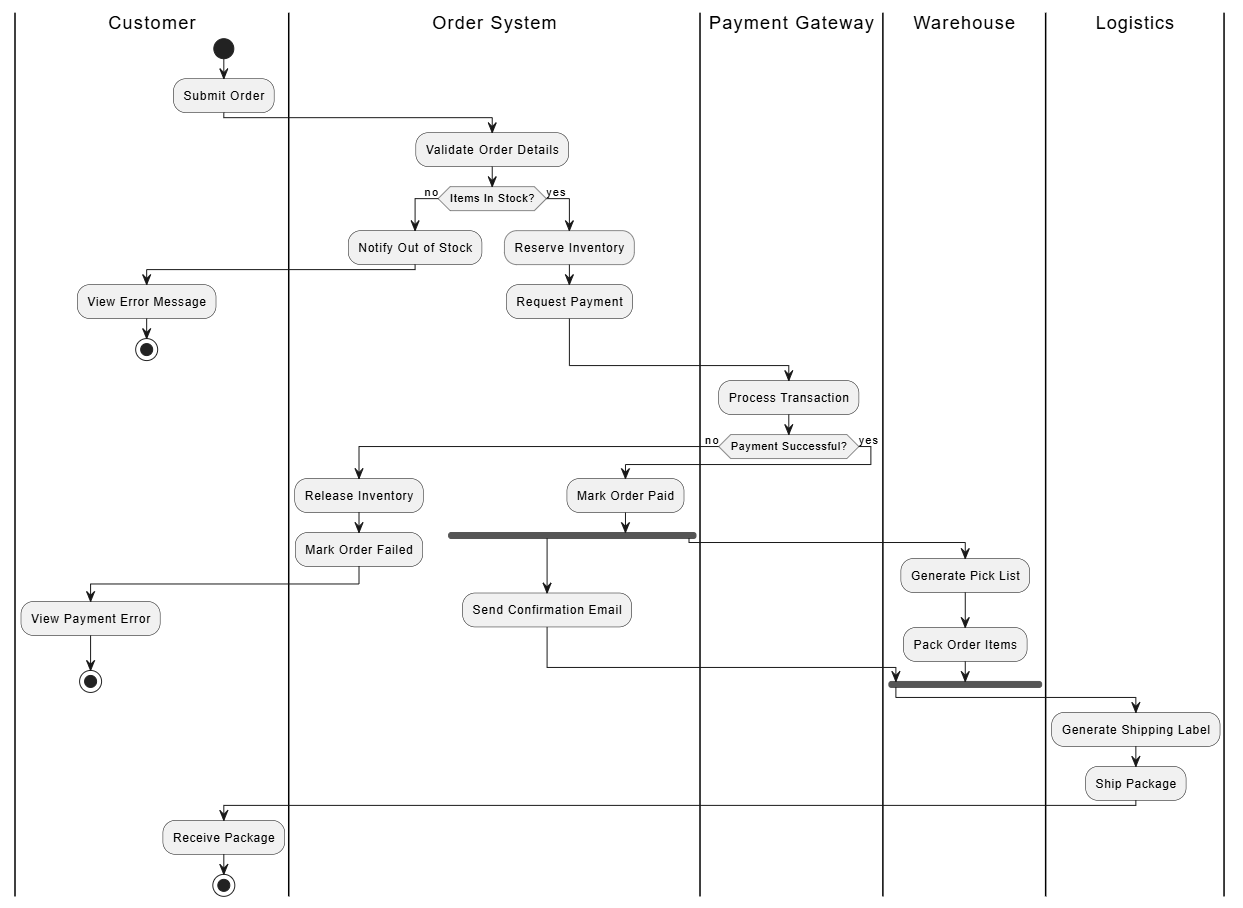
Purpose: Represents the flow of control and data, similar to flowcharts but more expressive.
When to Use:
Business process modeling
Algorithm visualization
Microservices orchestration
Key Notations:
Start/End nodes
Actions (rounded rectangles)
Decision nodes (diamonds)
Fork/Join (thick bars) for parallelism
Swimlanes (for responsibility partitioning)
This activity diagram models an e-commerce order fulfillment workflow, using swimlanes to partition responsibilities among customers, the order system, payment gateways, warehouses, and logistics partners. The process illustrates key UML concepts, including action nodes for steps (e.g., "Pack Order"), decision diamonds for stock and payment checks, and fork/join bars to handle parallel tasks like sending emails while packing items.
@startuml

|Customer|
start
:Submit Order;

|Order System|
:Validate Order Details;
if (Items In Stock?) then (no)
:Notify Out of Stock;

|Customer|
:View Error Message;
stop
else (yes)

|Order System|
:Reserve Inventory;
:Request Payment;
endif

|Payment Gateway|
:Process Transaction;
if (Payment Successful?) then (no)

|Order System|
:Release Inventory;
:Mark Order Failed;

|Customer|
:View Payment Error;
stop
else (yes)

|Order System|
:Mark Order Paid;

' Fork for Parallel Processing
fork
:Send Confirmation Email;
fork again

|Warehouse|
:Generate Pick List;
:Pack Order Items;
end fork

' Join and hand over to Logistics

|Logistics|
:Generate Shipping Label;
:Ship Package;
endif

|Customer|
:Receive Package;
stop
@enduml
Pro Tip: Combine with BPMN elements when modeling highly complex enterprise processes.
Purpose: Shows how an object’s state changes in response to events.
When to Use:
Modeling reactive systems
Order management, user sessions, device controllers
Game development or workflow engines
Key Elements:
States (rounded rectangles)
Transitions (arrows with triggers/guards/actions)
Initial and final states
Composite states
Example: Order states — Pending → Paid → Shipped → Delivered (with guards like [payment successful]).
Pending, Shipped). The initial circle marks the birth of the order, and the target circle marks its final archival state.Event Name.[condition]): Words enclosed in square brackets act as gates. A transition will only trigger if the condition is true (e.g., the order only moves from Pending to Paid if [payment successful] evaluates to true).InFulfillment): The large nested box groups related substates together. If a customer issues a Cancel Order event while the order is anywhere inside this box (whether it is currently being packed or sitting on a delivery truck), the system handles the cancellation uniformly.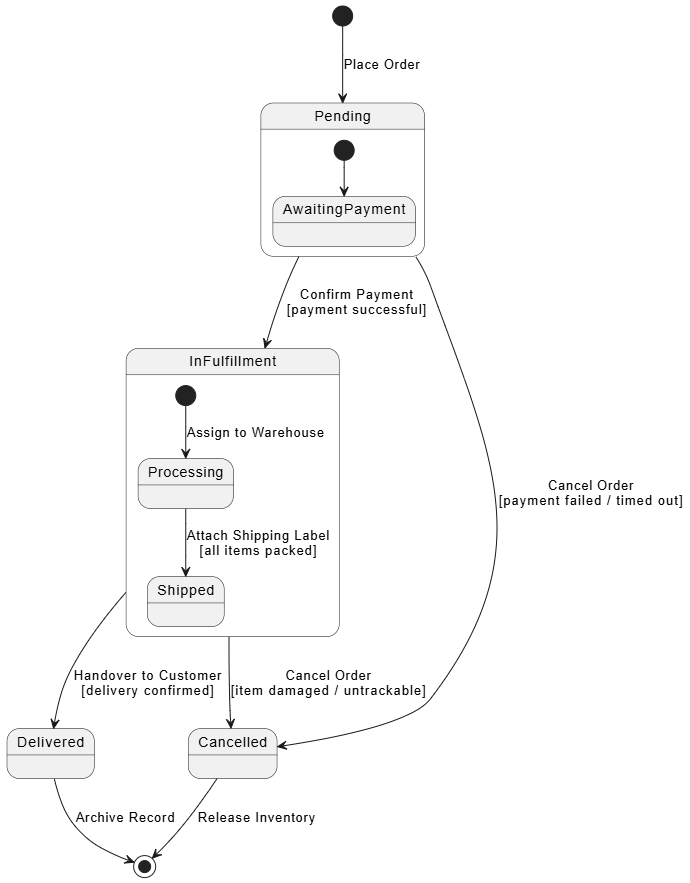
@startuml
[*] --> Pending : Place Order

state Pending {
[*] --> AwaitingPayment
}

Pending --> InFulfillment : Confirm Payment\n[payment successful]
Pending --> Cancelled : Cancel Order\n[payment failed / timed out]

state InFulfillment {
[*] --> Processing : Assign to Warehouse
Processing --> Shipped : Attach Shipping Label\n[all items packed]
}

InFulfillment --> Delivered : Handover to Customer\n[delivery confirmed]
InFulfillment --> Cancelled : Cancel Order\n[item damaged / untrackable]

Delivered --> [*] : Archive Record
Cancelled --> [*] : Release Inventory

@endumlPurpose: Shows the organization and dependencies between software components.
When to Use:
Microservices design
Modular monoliths
Defining interfaces and contracts
Key Elements:
Components (rectangle with protruding tabs)
Provided/Required interfaces (ball-and-socket notation)
Dependencies (dashed arrows)
Modern Relevance: Essential for designing scalable, replaceable services in cloud-native applications.
<<component>> stereotype. They act as independent, replaceable execution units (e.g., API Gateway, Order Service).Order API, Payment API).API Gateway consuming the Order API).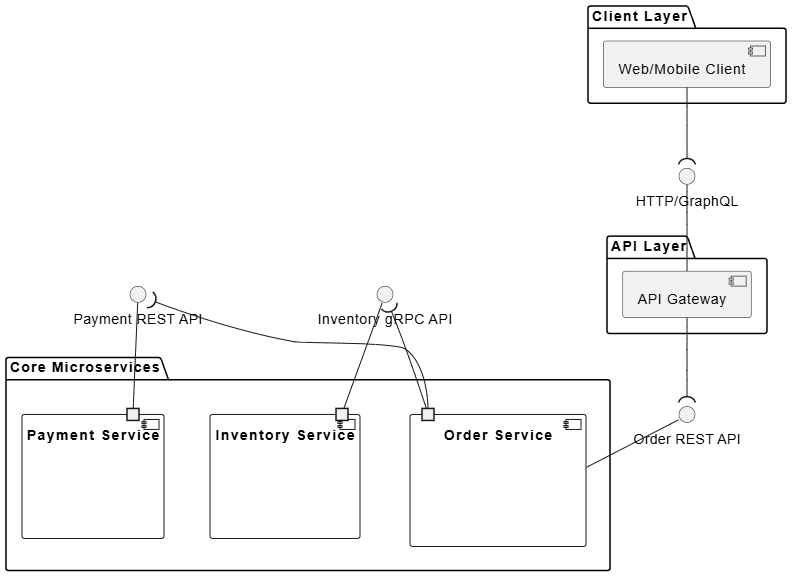
@startuml
skinparam componentStyle uml2

package "Client Layer" {
[Web/Mobile Client] as client
}

package "API Layer" {
component "API Gateway" as gateway
}

package "Core Microservices" {

component "Order Service" as orderService {
port " " as orderPortOut
}

component "Payment Service" as paymentService {
port " " as paymentPortIn
}

component "Inventory Service" as inventoryService {
port " " as inventoryPortIn
}
}

' Interface definitions
interface "HTTP/GraphQL" as clientApi
interface "Order REST API" as orderApi
interface "Payment REST API" as paymentApi
interface "Inventory gRPC API" as inventoryApi

' Connections and Ball-and-Socket notation
client --( clientApi
clientApi -- gateway

gateway --( orderApi
orderApi -- orderService

orderPortOut --( paymentApi
paymentApi -- paymentPortIn

orderPortOut --( inventoryApi
inventoryApi -- inventoryPortIn

@endumlPurpose: Shows the physical deployment of artifacts on nodes.
When to Use:
Cloud architecture planning
Infrastructure as Code (IaC) documentation
Performance and scalability discussions
Key Elements:
Nodes (3D cubes or rectangles)
Artifacts (files, executables)
Communication paths
Deployment specifications
CDN Node), managed public cloud boundaries (Cloud Provider Cluster), and dedicated virtual compute machines (Virtual Machine Node).Kubernetes Cluster node acts as the parent container host, nesting logical private virtual networks (Private Subnet) which in turn host auto-scaling worker nodes.Docker Container) wrapping execution binaries (Artifacts like .jar files).Serverless Function).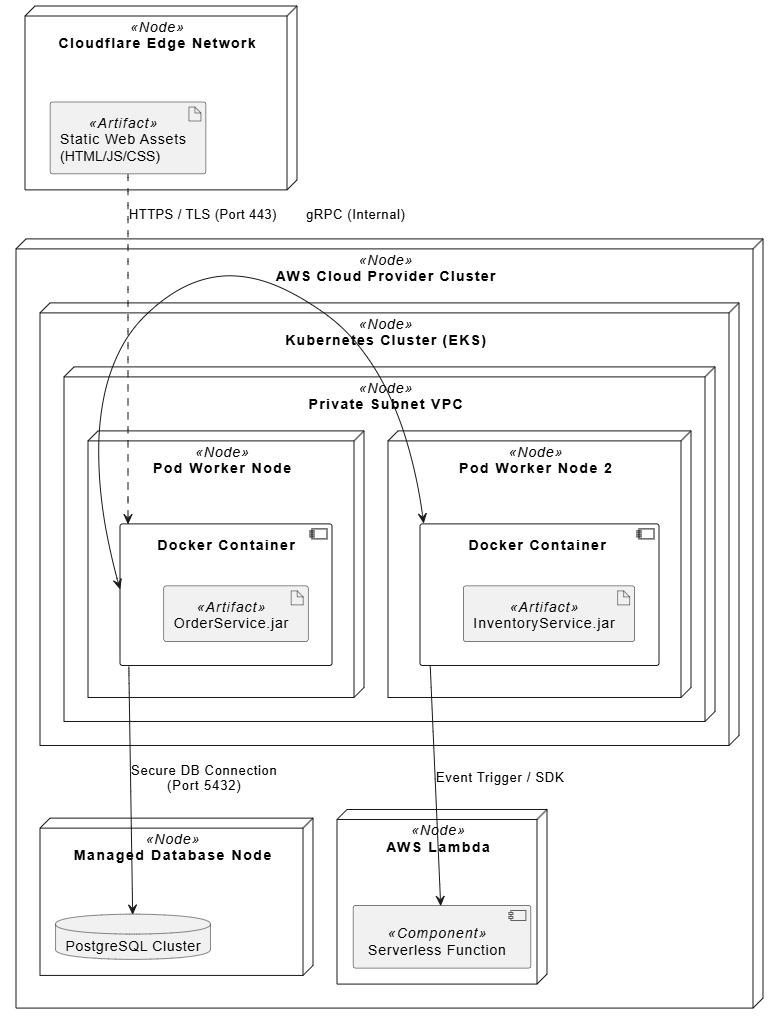
@startuml
skinparam componentStyle uml2
allow_mixing

node "Cloudflare Edge Network" as cdnNode <<Node>> {
artifact "Static Web Assets\n(HTML/JS/CSS)" as webStatic <<Artifact>>
}

node "AWS Cloud Provider Cluster" as awsCloud <<Node>> {

node "Kubernetes Cluster (EKS)" as k8sCluster <<Node>> {

node "Private Subnet VPC" as privateSubnet <<Node>> {

node "Pod Worker Node" as appPod <<Node>> {
component "Docker Container" as apiContainer {
artifact "OrderService.jar" as orderJar <<Artifact>>
}
}

node "Pod Worker Node 2" as workerPod <<Node>> {
component "Docker Container " as workerContainer {
artifact "InventoryService.jar" as inventoryJar <<Artifact>>
}
}
}
}

node "AWS Lambda" as serverlessNode <<Node>> {
component "Serverless Function" as imageResizer <<Component>>
}

node "Managed Database Node" as dbNode <<Node>> {
database "PostgreSQL Cluster" as postgresDb
}
}

' Communication paths and protocols
webStatic ..> apiContainer : "HTTPS / TLS (Port 443)"
apiContainer <-> workerContainer : "gRPC (Internal)"
apiContainer --> postgresDb : "Secure DB Connection\n(Port 5432)"
workerContainer --> imageResizer : "Event Trigger / SDK"

@enduml2025 Context: Include containers (Docker), orchestrators (Kubernetes), serverless functions, and CDN nodes.
| Situation | Best Diagram(s) |
|---|---|
| Requirements & Scope | Use Case |
| Static Structure | Class |
| User Flows / API Calls | Sequence |
| Business Processes | Activity |
| Object Behavior | State Machine |
| Modular Architecture | Component |
| Infrastructure | Deployment |
Be Selective — Don’t model everything. Focus on complex or high-risk parts.
Keep It Simple — Use only necessary elements. Overly detailed diagrams lose value.
Iterate — Treat diagrams as living documents (update them in code reviews or retrospectives).
Collaborate — Use tools that support real-time editing.
Combine with Code — Generate diagrams from code (PlantUML, Mermaid) and vice versa.
Use Stereotypes — Extend UML («microservice», «event», «bounded-context»).
Version Control — Store diagrams in the repository alongside code.
Free / Open Source: PlantUML, Mermaid.js, Draw.io (diagrams.net), Excalidraw
Professional: Enterprise Architect, Lucidchart, Visual Paradigm, Miro
AI-Assisted: Tools that generate UML from natural language prompts
Code-First: IntelliJ IDEA Ultimate, VS Code + extensions
Favorite Combo: Write diagrams in Mermaid syntax inside Markdown files for perfect Git integration.
Mastering these 7 UML diagrams won’t just make you a better modeler — it will sharpen your ability to think abstractly, reduce misunderstandings, and design more robust systems.
Start small: Pick one complex feature in your current project and create the relevant diagrams. You’ll quickly see the value.
Next Steps:
Practice drawing all 7 diagrams for a familiar system (e.g., Netflix or Uber).
Learn Mermaid syntax for fast diagramming.
Share your diagrams with your team and gather feedback.
Would you like:
Detailed examples with Mermaid code for any of these diagrams?
A downloadable UML cheat sheet?
Advanced topics (Composite Structure, Timing, or Profiles)?
Let me know how to deepen this guide for you!