
In the realm of software engineering and system design, the Unified Modeling Language (UML) provides a standardized way to visualize the architecture of a system. Among the various UML diagram types, interaction diagrams are crucial for modeling the dynamic behavior of a system—specifically, how objects interact with one another to fulfill specific use cases.
The two most prominent types of interaction diagrams are Sequence Diagrams and Communication Diagrams. While they are semantically equivalent—meaning they contain the exact same underlying information and can be converted into one another without any loss of data—they differ significantly in their visual emphasis, layout, and specific notation.
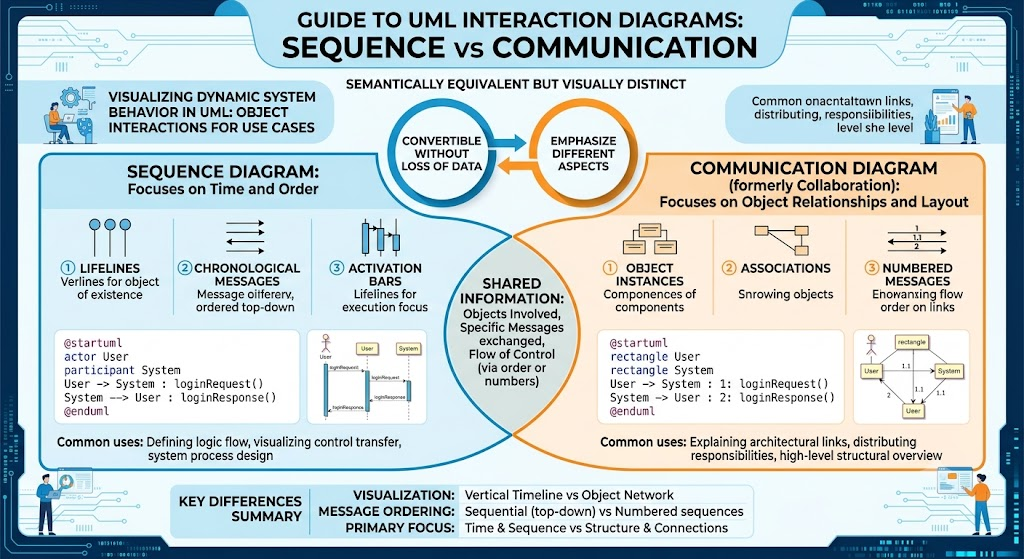
This guide explores the key concepts, differences, and practical applications of both diagrams, complete with PlantUML examples to help you visualize their distinct approaches to modeling object interactions.
To effectively use these diagrams, it is essential to understand their unique focuses, temporal representations, and notational differences.
Before diving into their differences, it is important to recognize that sequence and communication diagrams are two sides of the same coin. They model the exact same interactions and message flows. The choice between them is purely about visual emphasis—whether you want to highlight the flow of time or the structural relationships between objects.
Sequence diagrams are the most commonly used interaction diagrams, favored for their intuitive representation of time.
Primary Focus: They prioritize the time-ordering of messages exchanged between objects. They are highly effective for working through specific use cases step-by-step and allocating required behavior to participating objects.
Temporal Representation: Time is represented vertically, flowing from top to bottom.
Lifelines: Dashed vertical lines dropping down from the objects represent the existence of the object over time.
Focuses of Control: Also known as activation bars, these are vertical rectangles on the lifeline that indicate the exact period an object is active and processing a message.
Notation: Sequence diagrams explicitly map the entire lifespan of objects involved in the interaction. They can show the creation of new objects and the destruction of existing ones, typically marked with an "X" at the bottom of a lifeline to indicate the end of an instance's life.
Formerly known as collaboration diagrams in earlier UML versions, communication diagrams offer a more structural perspective.
Primary Focus: They focus on the architecture of the internal structure and how that structural layout corresponds with the passing of messages.
Temporal Representation: Unlike sequence diagrams, they do not use lifelines or focuses of control. Instead of a vertical time axis, they rely on sequence numbers placed on the message arrows (e.g., 1:, 2:, 2.1:) to indicate the relative execution order and nesting of communications.
Notation: The visual emphasis is heavily placed on the structural links (associations) between objects. The spatial arrangement of the objects on the canvas is meant to reflect the organizational structure of the system rather than a chronological timeline.
| Feature | Sequence Diagram | Communication Diagram |
|---|---|---|
| Best Used For | Viewing exact timing and order of events. | Viewing the organizational structure of interacting objects. |
| Time Axis | Vertical (Top to Bottom). | Implied via numbered sequence labels. |
| Visual Elements | Lifelines, Focuses of Control (Activation bars). | Structural links, Sequence numbers on arrows. |
| Object Lifecycle | Explicitly shows creation and destruction ("X"). | Focuses on existing structural links. |
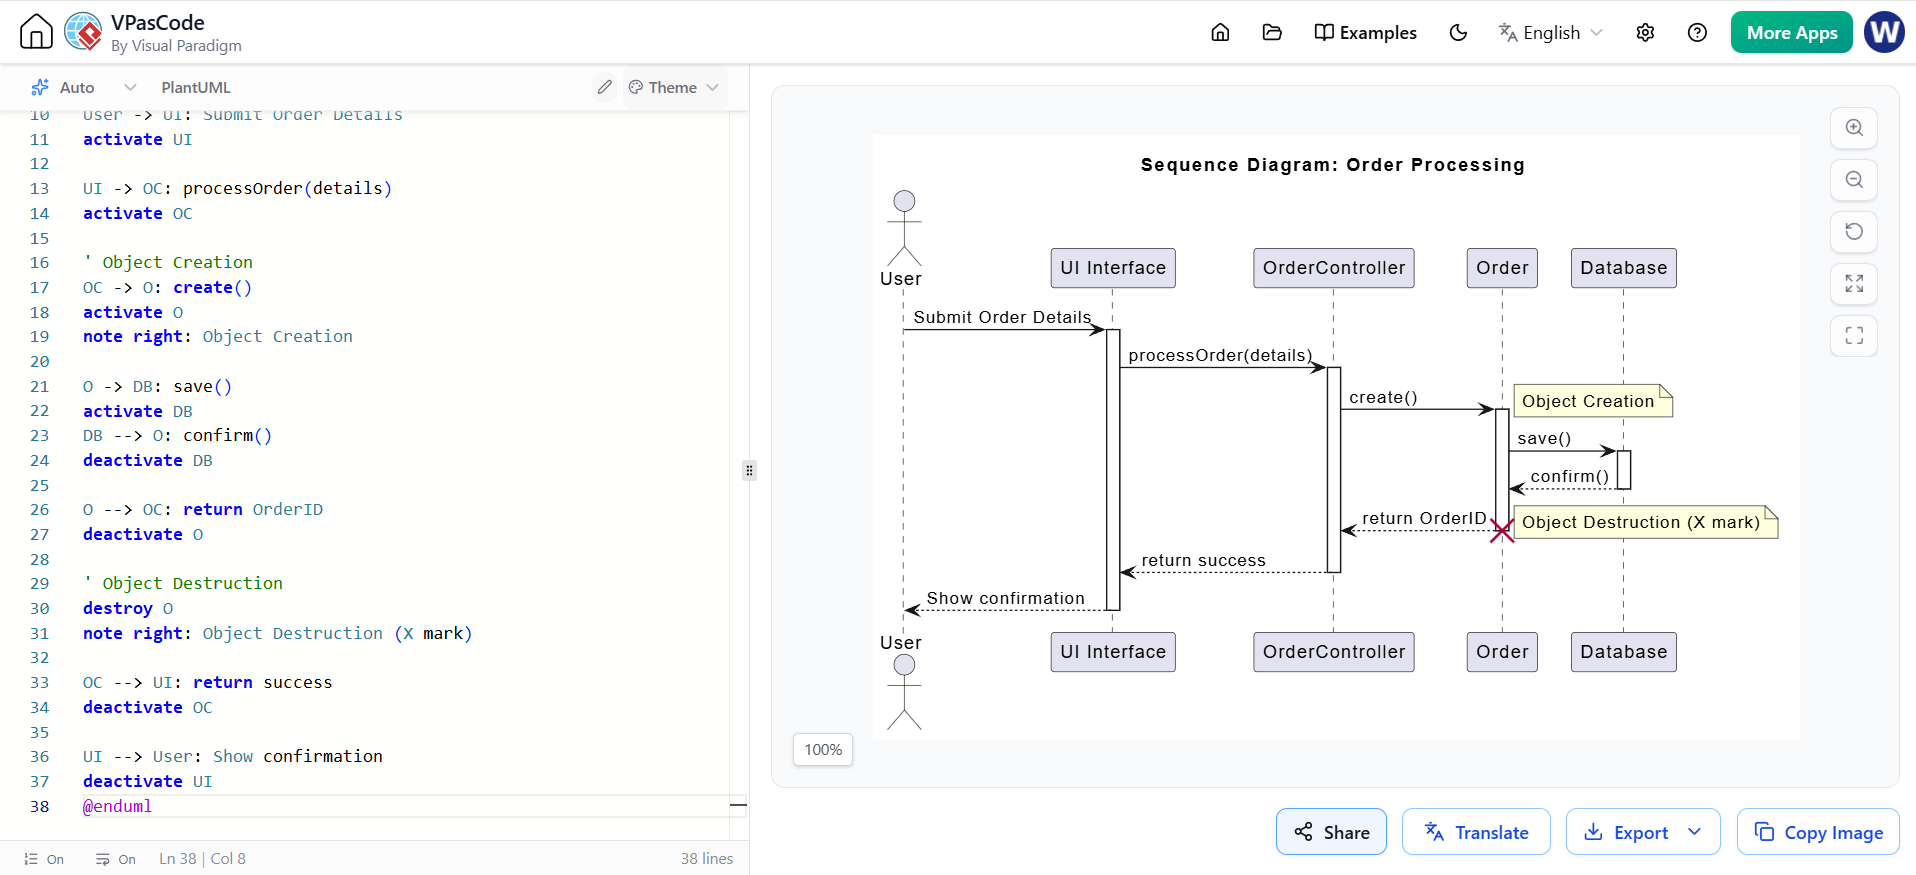
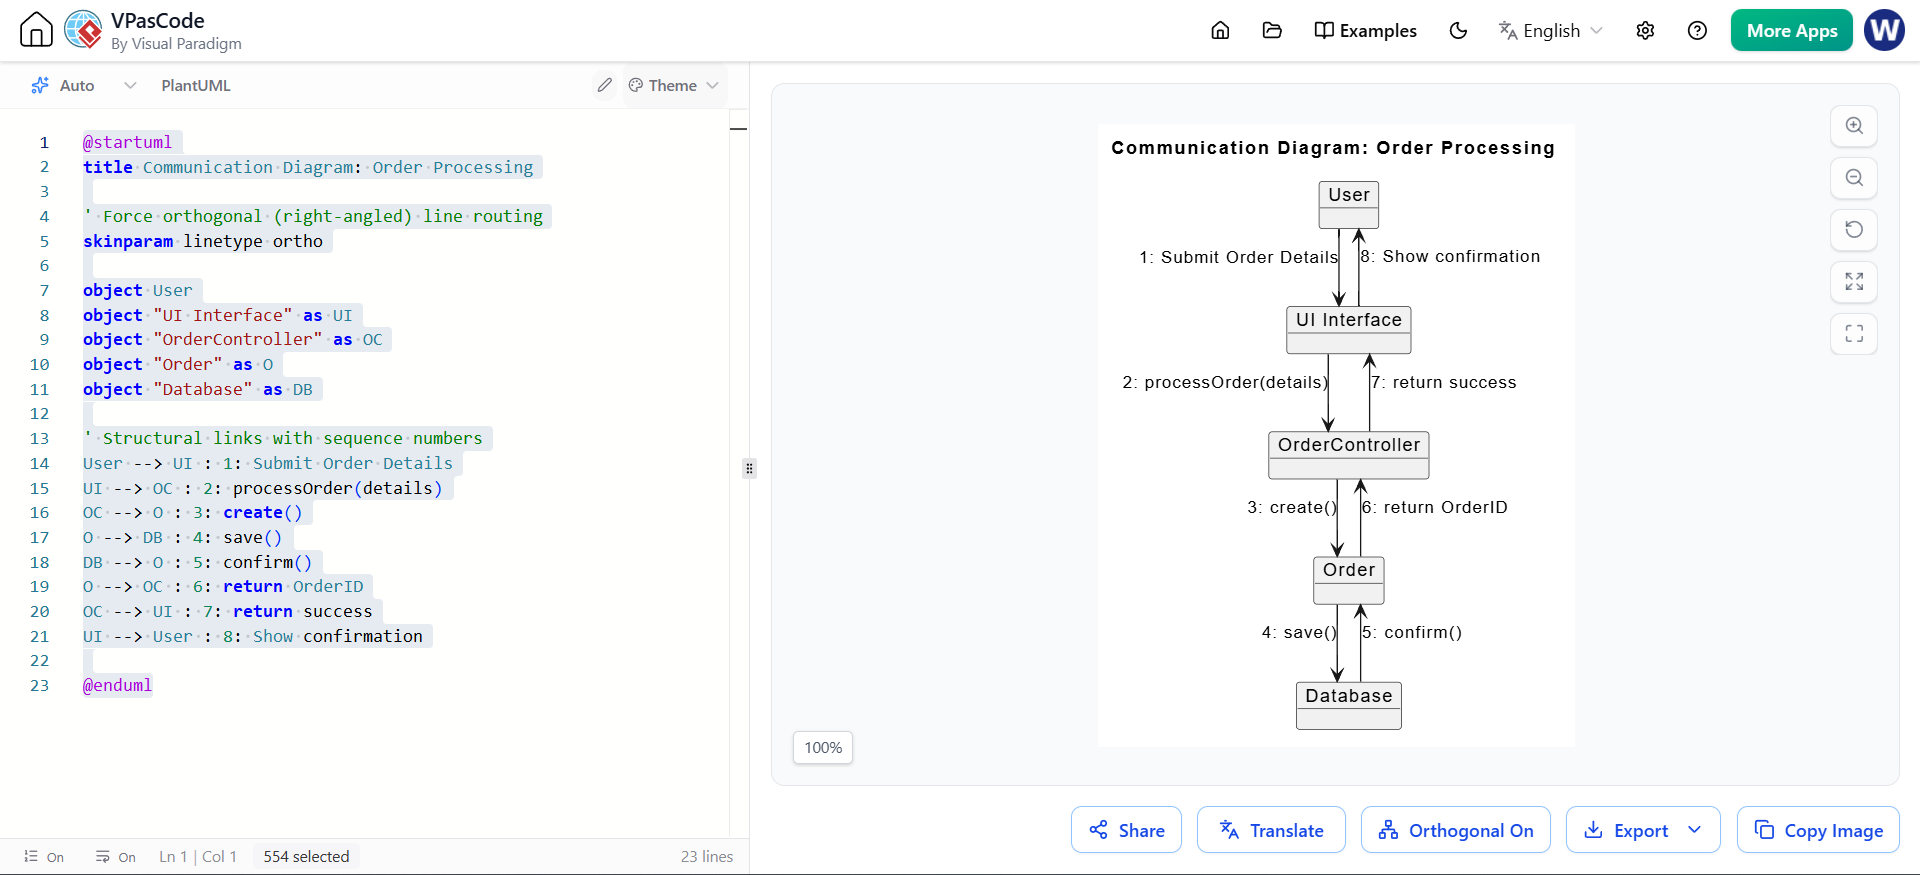
Below are PlantUML code examples demonstrating both diagrams modeling the exact same scenario: A User submitting an order, which creates an Order object, saves it to the database, and returns a confirmation.
Notice the vertical flow, the use of activate/deactivate (focuses of control), and the destroy command (the "X" mark) to show the end of the Order object's lifecycle.
@startuml
title Sequence Diagram: Order Processing

actor User
participant "UI Interface" as UI
participant "OrderController" as OC
participant "Order" as O
participant "Database" as DB

User -> UI: Submit Order Details
activate UI

UI -> OC: processOrder(details)
activate OC

' Object Creation
OC -> O: create()
activate O
note right: Object Creation

O -> DB: save()
activate DB
DB --> O: confirm()
deactivate DB

O --> OC: return OrderID
deactivate O

' Object Destruction
destroy O
note right: Object Destruction (X mark)

OC --> UI: return success
deactivate OC

UI --> User: Show confirmation
deactivate UI
@enduml
Notice the absence of vertical lifelines and activation bars. Instead, the objects are linked structurally, and the chronological order is dictated entirely by the numbered prefixes on the messages
(e.g., 1:, 2:, 3:).
@startuml
title Communication Diagram: Order Processing

' Force orthogonal (right-angled) line routing
skinparam linetype ortho

object User
object "UI Interface" as UI
object "OrderController" as OC
object "Order" as O
object "Database" as DB

' Structural links with sequence numbers
User --> UI : 1: Submit Order Details
UI --> OC : 2: processOrder(details)
OC --> O : 3: create()
O --> DB : 4: save()
DB --> O : 5: confirm()
O --> OC : 6: return OrderID
OC --> UI : 7: return success
UI --> User : 8: Show confirmation

@enduml(Note: In PlantUML, communication diagrams are rendered by applying sequence numbers to standard links, allowing the renderer to focus on the structural connections rather than a strict vertical timeline.)
Both sequence and communication diagrams are indispensable tools in the UML toolkit for modeling dynamic system behavior. Because they are semantically equivalent, the choice between them should be driven entirely by the story you are trying to tell.
If your goal is to debug a complex process, clarify the exact timing of events, or document the lifecycle (creation and destruction) of objects, the Sequence Diagram is your best choice. Its vertical timeline makes the chronological flow of control incredibly easy to follow.
Conversely, if you want to highlight the structural relationships between objects, emphasize the architecture of the internal system, or show how a specific network of objects collaborates to pass messages, the Communication Diagram provides a superior, structure-centric view.
By mastering both, software architects and developers can choose the exact right visual lens to communicate their system's design clearly and effectively.

