In the world of software architecture and system design, clarity and navigability are paramount. As systems grow in complexity, traditional UML diagrams can become overwhelming, making it difficult to grasp the big picture of how different components interact. Enter the UML Interaction Overview Diagram—a powerful hybrid modeling tool that bridges the gap between high-level process flow and detailed interaction logic.
This guide provides a comprehensive exploration of Interaction Overview Diagrams, from foundational concepts to practical implementation. Whether you're a system architect, business analyst, or software developer, you'll learn how to leverage this diagram type to decompose complex workflows, improve team collaboration, and create maintainable, navigable system documentation. By the end of this article, you'll understand not only what Interaction Overview Diagrams are, but when and how to use them effectively in your next project.
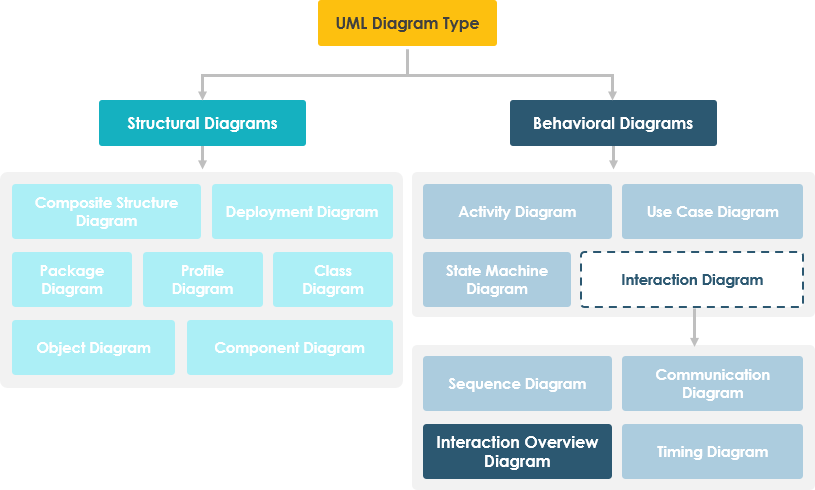
UML Interaction Overview Diagrams provide a high level of abstraction for interaction models. It is a variant of the Activity Diagram where the nodes are the interactions or interaction occurrences. The Interaction Overview Diagram focuses on the overview of the flow of control of the interactions which can also show the flow of activity between diagrams. In other words, you can link up the "real" diagrams and achieve high degree navigability between diagrams inside an Interaction Overview Diagram.
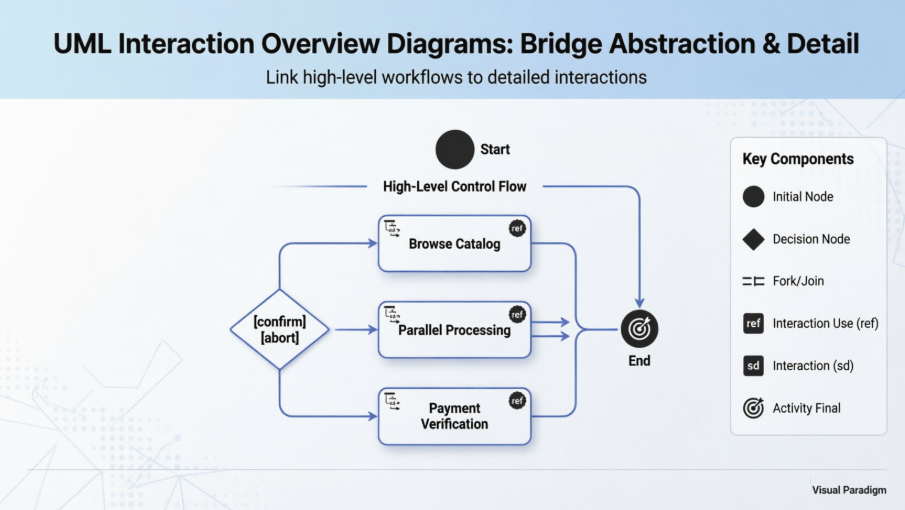
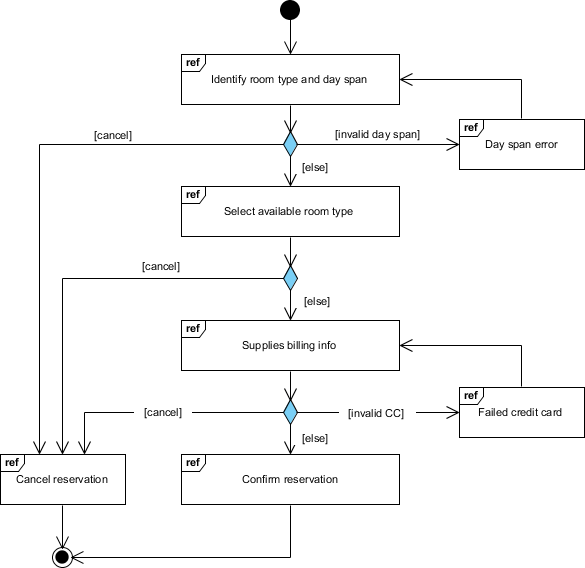
The UML Interaction Overview Diagram that maps the high-level control flow of an online purchase process. It uses a hybrid notation that combines activity diagram nodes with sequence diagram frames to visualize complex interactions.
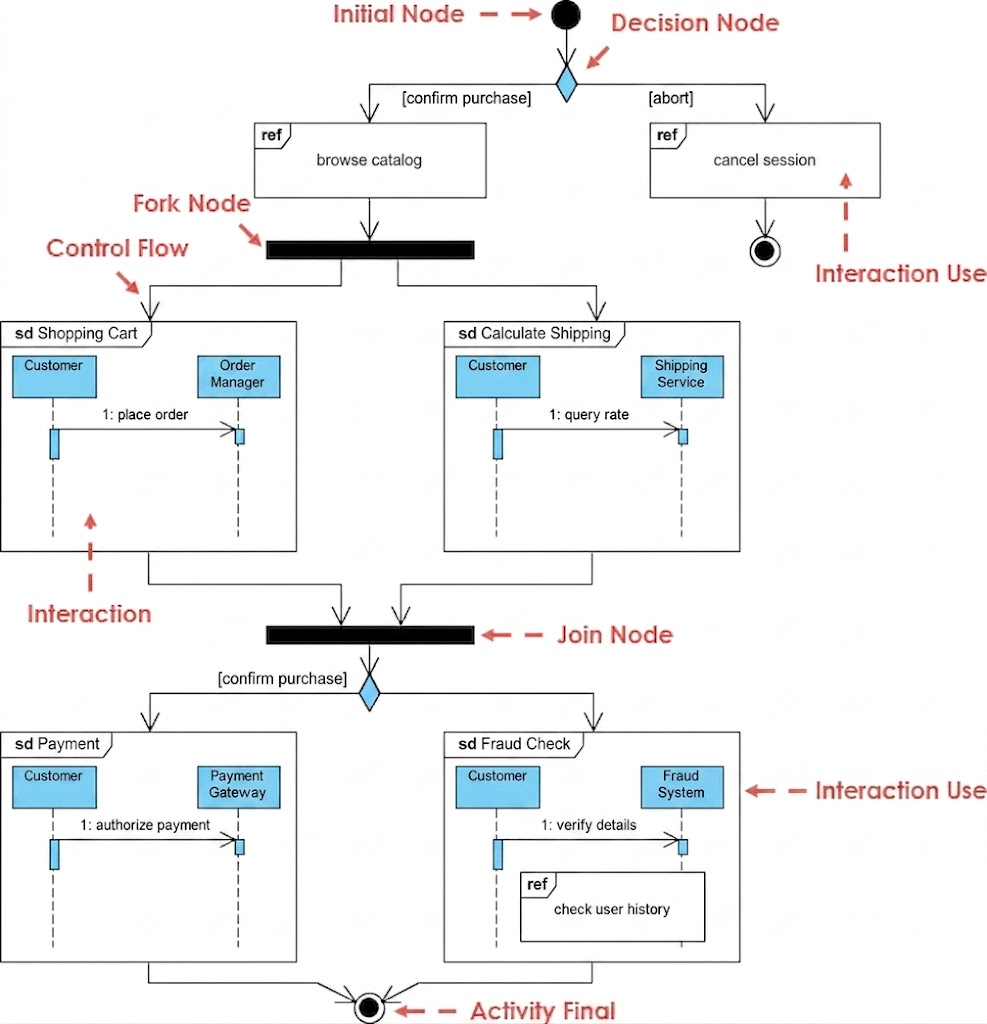
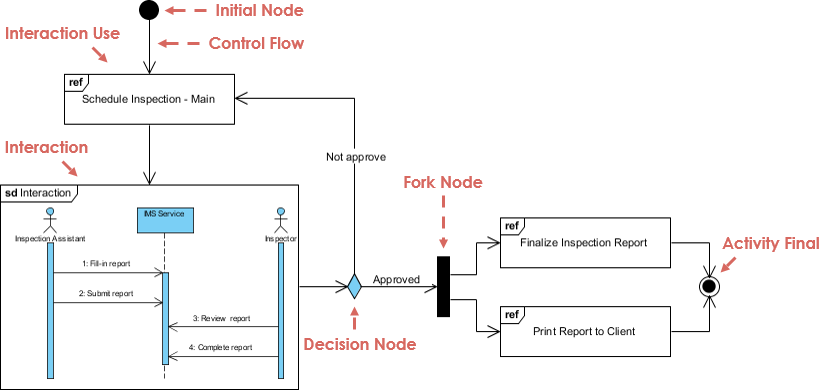
Following the style of image_aa070d.png, this diagram utilizes several standard UML elements to define the workflow:
Initial Node: Represented by a solid black circle at the top, this marks the starting point of the purchase process.
Decision Nodes: These diamond-shaped symbols represent branch points where the flow chooses a path based on guard conditions, such as [confirm purchase] or [abort].
Fork and Join Nodes: Horizontal black bars used to manage parallel processing. The Fork Node splits the flow into concurrent tasks, while the Join Node synchronizes them back into a single flow.
Interaction Uses (ref): These rectangular boxes with a "ref" tag in the corner act as placeholders for other detailed interactions, such as browse catalog or cancel session, which are defined elsewhere.
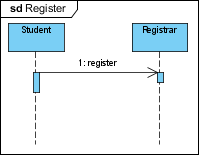
Interactions (sd): These frames (labeled with "sd") provide nested Sequence Diagrams that show direct communication between lifelines, such as the Customer and the Order Manager.
Activity Final: A "bullseye" symbol at the bottom indicating the successful or unsuccessful completion of the entire process.
The diagram breaks the purchase down into three primary stages:
The process begins at the Initial Node and immediately hits a Decision Node. If the user chooses to [abort], the flow moves to the cancel session interaction and ends. If they [confirm purchase], the flow enters the browse catalog interaction.
After browsing, the flow hits a Fork Node. This triggers two concurrent interactions:
sd Shopping Cart: The Customer sends a 1: place order message to the Order Manager.
sd Calculate Shipping: Simultaneously, the Customer sends a 1: query rate message to the Shipping Service.
These two paths must both complete before reaching the Join Node.
Once the order and shipping details are synchronized at the Join Node, a final Decision Node directs the flow:
sd Payment: The Customer authorizes payment via the Payment Gateway.
sd Fraud Check: The Customer details are verified by the Fraud System, which includes a nested ref call to check user history.
The process concludes at the Activity Final node, signifying the order has been processed.
| Node Type | Notation |
|---|---|
| Interaction An Interaction diagram of any kind may appear inline as an Activity Invocation. |
 |
| Interaction Use Large and complex sequence diagrams could be simplified with interaction uses. It is also common to reuse some interaction between several other interactions. |
 |
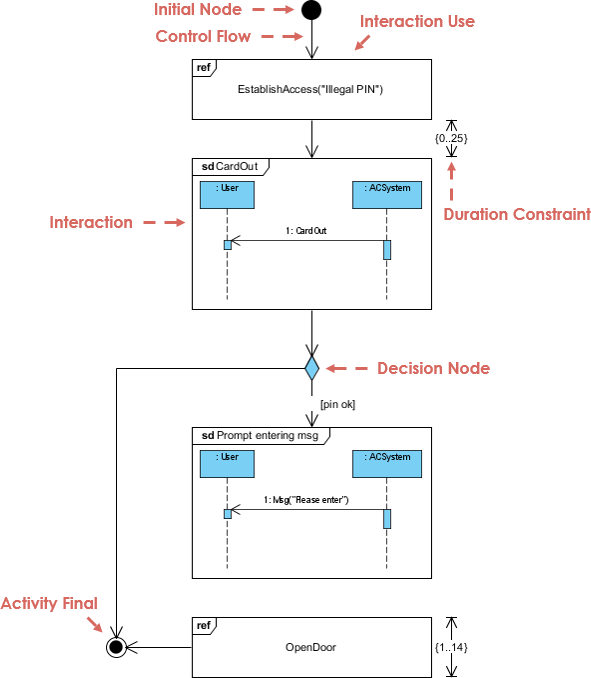
The Interaction EstablishAccess occurs first with argument "Illegal PIN" followed by an interaction with the message CardOut which is shown in an inline Interaction.
Then there is an alternative as we find a decision node with an InteractionConstraint on one of the branches.
Along that control flow we find another inline Interaction and an InteractionUse in the sequence.
In this diagram, we want to produce and format an order summary report. If the customer is external, we get the information from XML; if internal, we get it from a database. Small sequence diagrams show the two alternatives. Once we get the data, we format the report; in this case, we don't show the sequence diagram but simply reference it with a reference interaction frame.
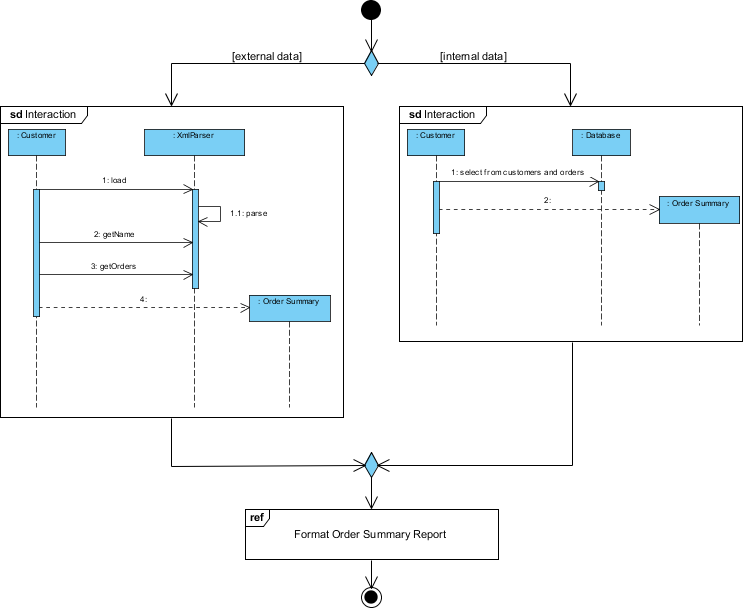
*extracted from UML Distilled 3 interaction overview example
In Visual Paradigm, an Interaction Overview Diagram is a specialized UML diagram that provides a high-level view of how multiple interaction diagrams (like sequence or communication diagrams) connect to form a complete system process. It is technically a variant of the Activity Diagram, using the same control flow logic but replacing activity nodes with interaction elements.
Interaction Reference (ref): Instead of detailed messages, you place a frame that references an existing sequence diagram or other interaction models.
Inline Interactions (sd): You can embed small, simplified versions of interaction diagrams directly within the flow nodes.
Control Flow Nodes: Just like in an Activity Diagram, you use Initial, Final, Decision, Merge, Fork, and Join nodes to manage the logic of the interactions.
Diagram Navigation: You can link high-level nodes to detailed diagrams, allowing you to click through and explore specific logic.
To start a new Interaction Overview Diagram in Visual Paradigm Desktop:
Go to the application toolbar and select Diagram > New.
Search for and select Interaction Overview Diagram from the list.
Enter a name for your diagram and click OK.
Use the Resource Catalog (the icon that appears when clicking a shape) to quickly drag and drop new nodes like Interaction Uses or control flows.
This diagram is best for managing complexity. When a single sequence diagram becomes too large and difficult to read, you can break it into smaller fragments and use the Interaction Overview Diagram to show how those fragments relate.
UML Interaction Overview Diagrams represent a strategic evolution in system modeling—offering the perfect balance between abstraction and detail. By combining the control-flow logic of Activity Diagrams with the interaction-focused semantics of Sequence Diagrams, they empower teams to navigate complex system behaviors with confidence and clarity.
Whether you're documenting an e-commerce checkout flow, designing an access control system, or orchestrating a multi-service scheduling platform, Interaction Overview Diagrams provide the scaffolding needed to keep your architecture understandable, maintainable, and scalable. With tools like Visual Paradigm streamlining their creation and navigation, there's never been a better time to integrate this powerful diagram type into your modeling toolkit.
Start small: identify one overly complex sequence diagram in your current project, decompose it into logical fragments, and map their relationships using an Interaction Overview Diagram. You'll quickly discover how this approach enhances communication, reduces cognitive load, and ultimately leads to better-designed systems.