In the landscape of modern software engineering, capturing the dynamic behavior of interacting objects is as crucial as defining their static structure. The Unified Modeling Language (UML) 2.x provides a robust set of interaction diagrams to model these behaviors, among which the Communication Diagram plays a pivotal role. Formerly known as the Collaboration Diagram in UML 1.x, the Communication Diagram in UML 2.x emphasizes the structural organization of objects and the messages they exchange to accomplish a specific task.
This case study delves into the application of UML 2.x Communication Diagrams through a practical ticket reservation system. By focusing on the spatial arrangement of objects, the links that connect them, and the sequenced messages that flow across these links, we illustrate how Communication Diagrams effectively model the implementation of operations. This article also contrasts Communication Diagrams with Sequence Diagrams, providing architects and developers with clear guidelines on selecting the appropriate visualization tool based on whether structural relationships or time-ordered flows are the primary concern.
Domain: Event Management & Ticketing Platform
Interaction Focus: Reserve Tickets use case
Modeling Goal: Visualize the structural organization of objects, communication links, and sequenced message passing during a complex reservation workflow.
Primary Challenge: Accurately representing both persistent associations and transient links while maintaining clarity in message sequencing and operation implementation within the UML 2.x framework.
A Communication Diagram in UML 2.x models the interactions between objects or parts in terms of sequenced messages. It represents a combination of information taken from Class, Sequence, and Use Case Diagrams, describing both the static structure and dynamic behavior of a system.
Key UML 2.x Concepts:
Lifelines: Represent the participating objects (formerly Classifier Roles). They are depicted as rectangles containing the object name and class.
Connectors (Links): Represent the communication paths between lifelines (formerly Association Roles). Messages can only be sent across existing connectors.
Messages: Arrows attached to connectors indicating the communication. In UML 2.x, messages are explicitly numbered to indicate sequence.
Sequence Numbers: A critical feature of Communication Diagrams. They use a flat numbering scheme (e.g., 1, 2, 3, 4) to indicate the chronological order of messages, replacing the implicit vertical time axis of Sequence Diagrams.
Fragments: UML 2.x allows for interaction fragments (like loop, alt, opt) to be represented, adding logical complexity to the structural view.
Communication Diagrams are particularly effective for visualizing the structural context of an interaction. They answer the question: “Which objects are talking to each other, and in what order?” making them ideal for analyzing the impact of changes to object relationships.
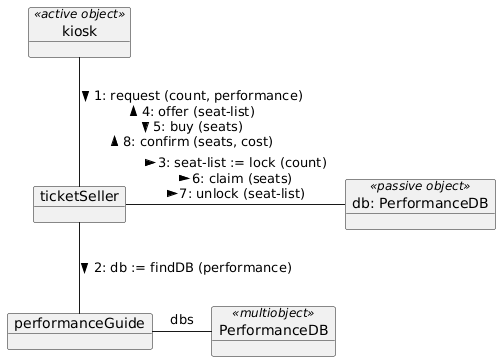
The system under analysis is a distributed ticketing application. The reserve tickets interaction is initiated when a customer uses a kiosk to book seats for a performance. The workflow requires the system to locate the specific database for that performance, query seat availability, apply temporary locks to prevent double-booking, present options to the user, and finalize the transaction.
Key System Lifelines (Objects):
«active object» kiosk (The user interface terminal – active object)
ticketSeller (The central controller handling business logic)
performanceGuide (Registry service for locating performance databases)
«multiobject» PerformanceDB (Collection of all performance databases)
«passive object» db: PerformanceDB (The specific database instance for a show – passive object)
In the Communication Diagram for this scenario, the lifelines are arranged geometrically to minimize crossing connectors, emphasizing the network of relationships. The interaction logic is conveyed through numbered messages attached to these connectors using a flat sequential numbering scheme.
Interaction Flow and Message Sequencing:
| Seq # | Message | Source → Destination | Context & UML 2.x Notes |
|---|---|---|---|
1: |
request(count, performance) |
kiosk → ticketSeller |
Synchronous Call: Customer initiates reservation with seat count and performance ID. |
2: |
db := findDB(performance) |
ticketSeller → performanceGuide |
Lookup Service: Returns a reference to the specific PerformanceDB instance. |
3: |
seat-list := lock(count) |
ticketSeller → db: PerformanceDB |
Transient Link: Uses the db reference to lock available seats temporarily. |
4: |
offer(seat-list) |
ticketSeller → kiosk |
User Feedback: Presents the locked seats to the customer for review. |
5: |
buy(seats) |
kiosk → ticketSeller |
User Action: Customer selects specific seats to purchase. |
6: |
claim(seats) |
ticketSeller → db: PerformanceDB |
Permanent Reservation: Converts temporary lock to permanent claim. |
7: |
unlock(seat-list) |
ticketSeller → db: PerformanceDB |
Cleanup: Releases locks on seats not selected by the customer. |
8: |
confirm(seats, cost) |
ticketSeller → kiosk |
Completion: Returns confirmation with final seat assignments and total cost. |
Architectural Insights from the Diagram:
Active vs. Passive Objects: The diagram explicitly marks kiosk as an «active object» (initiates control flow) and db: PerformanceDB as a «passive object» (responds to requests), clarifying the control responsibilities in the system.
Multiobject Pattern: The «multiobject» PerformanceDB represents a collection of database instances, while db: PerformanceDB is a specific instance selected at runtime. This distinction is crucial for understanding the system’s scalability.
Transient Link Establishment: Message 2 returns a db reference that is subsequently used in messages 3, 6, and 7. This demonstrates how Communication Diagrams model dynamic link creation and usage within an interaction’s scope.
Flat Numbering Scheme: Unlike hierarchical numbering, the flat sequence (1, 2, 3, 4, 5, 6, 7, 8) emphasizes the linear progression of the interaction while the geometric layout reveals the structural relationships.
Lock Management Pattern: The three-message sequence to the database (lock → claim → unlock) reveals a critical concurrency control pattern that ensures data integrity during the reservation window.
Both Communication Diagrams and Sequence Diagrams are classified as Interaction Diagrams in UML 2.x and are semantically equivalent (they can be transformed into one another). However, they serve different analytical purposes:
| Feature | Sequence Diagram | Communication Diagram |
|---|---|---|
| Primary Focus | Time ordering and interaction duration. | Structural organization and object relationships. |
| Layout | Vertical axis represents time; horizontal axis represents objects. | Free-form geometric arrangement (network graph). |
| Message Ordering | Implicit via vertical position. | Explicit via flat sequence numbers (e.g., 1, 2, 3). |
| Link Visibility | Implicit (messages imply a link exists). | Explicit (connectors must be drawn between lifelines). |
| Object Stereotypes | Less commonly shown. | Clearly visible (e.g., «active object», «passive object», «multiobject»). |
| Best Use Case | Real-time systems, complex timing constraints, detailed scenario walkthroughs. | Analyzing object coupling, refactoring class structures, visualizing complex object networks. |
Guideline for Architects:
Use a Sequence Diagram when the “when” and “how long” are critical (e.g., timeouts, parallel threads). Use a Communication Diagram when the “who” and “with whom” are critical (e.g., determining which classes need to be coupled, identifying circular dependencies, understanding object stereotypes and roles).
Flat Sequence Numbering: Use simple integers (1, 2, 3, 4…) to denote message order. This flat numbering emphasizes the chronological flow while the spatial layout shows structure.
Object Stereotypes: Explicitly mark objects with stereotypes like «active object», «passive object», or «multiobject» to clarify their behavioral characteristics and roles in the interaction.
Message Direction and Labels: Ensure arrows clearly indicate the direction of message flow. Include parameter lists and return values (e.g., db := findDB(performance)) to show data flow.
Transient vs. Persistent Links: Use the diagram to show how references are created (message 2 returns db) and subsequently used (messages 3, 6, 7 use db), making the lifecycle of transient links explicit.
Avoid Clutter: If the number of crossing connectors becomes unmanageable, the system may be too tightly coupled, or a Sequence Diagram might be a better choice for that specific interaction.
Multiobject Notation: Use «multiobject» to represent collections or arrays of objects when the interaction involves selecting or iterating over multiple instances.
The UML 2.x Communication Diagram is an indispensable tool for software architects who need to visualize the structural fabric of an interaction. By shifting the focus from the vertical progression of time to the geometric arrangement of objects, it reveals the underlying network of dependencies and message flows that drive system behavior.
Through the ticket reservation case study, we demonstrated how Communication Diagrams effectively model complex workflows involving transient links, object stereotypes, and specific object collaborations. The flat message numbering scheme (1, 2, 3…8) provides clear chronological ordering while the spatial layout emphasizes the structural relationships between active objects, passive objects, and multiobjects.
While semantically equivalent to Sequence Diagrams, the Communication Diagram offers a unique perspective that prioritizes object relationships over chronological sequencing. By mastering both diagram types, development teams can ensure a comprehensive understanding of their system’s behavior, leading to more robust, maintainable, and well-structured software architectures.