
In the complex world of software engineering, modeling the behavior of a system often requires a balance between high-level logic and granular detail. While Sequence Diagrams are excellent for showing message ordering and Communication Diagrams excel at showing object relationships, they can quickly become unreadable when applied to massive, end-to-end processes.
Enter the UML Interaction Overview Diagram. This powerful modeling tool acts as a hybrid, combining the control flow logic of an Activity Diagram with the detailed behavioral descriptions of other Interaction Diagrams (like Sequence, Communication, and Timing diagrams). It serves as a "map" of the system's behavior, allowing architects to break down complex scenarios into manageable, distinct interactions without losing sight of the overall process flow.
This guide explores the structure, components, and practical application of Interaction Overview Diagrams, using a concrete example to demonstrate how to model a system effectively.
An Interaction Overview Diagram is essentially a flowchart where the "actions" are actually entire interaction diagrams. Instead of simple processing steps, each node in the flow represents a specific interaction between system components.
Interaction Frames: These are the boxes containing the detailed diagrams. They are labeled with types such as sd (Sequence Diagram), cd (Communication Diagram), or td (Timing Diagram).
Control Flow Nodes: Borrowed from Activity Diagrams, these include:
Initial/Final Nodes: Start and end points.
Fork/Join Bars: For parallel processing.
Decision/Merge Diamonds: For conditional logic (if/else) and loops.
Based on the Figure below, let's trace the control flow of a hypothetical system process. This example demonstrates how different diagram types are woven together to tell a complete story.
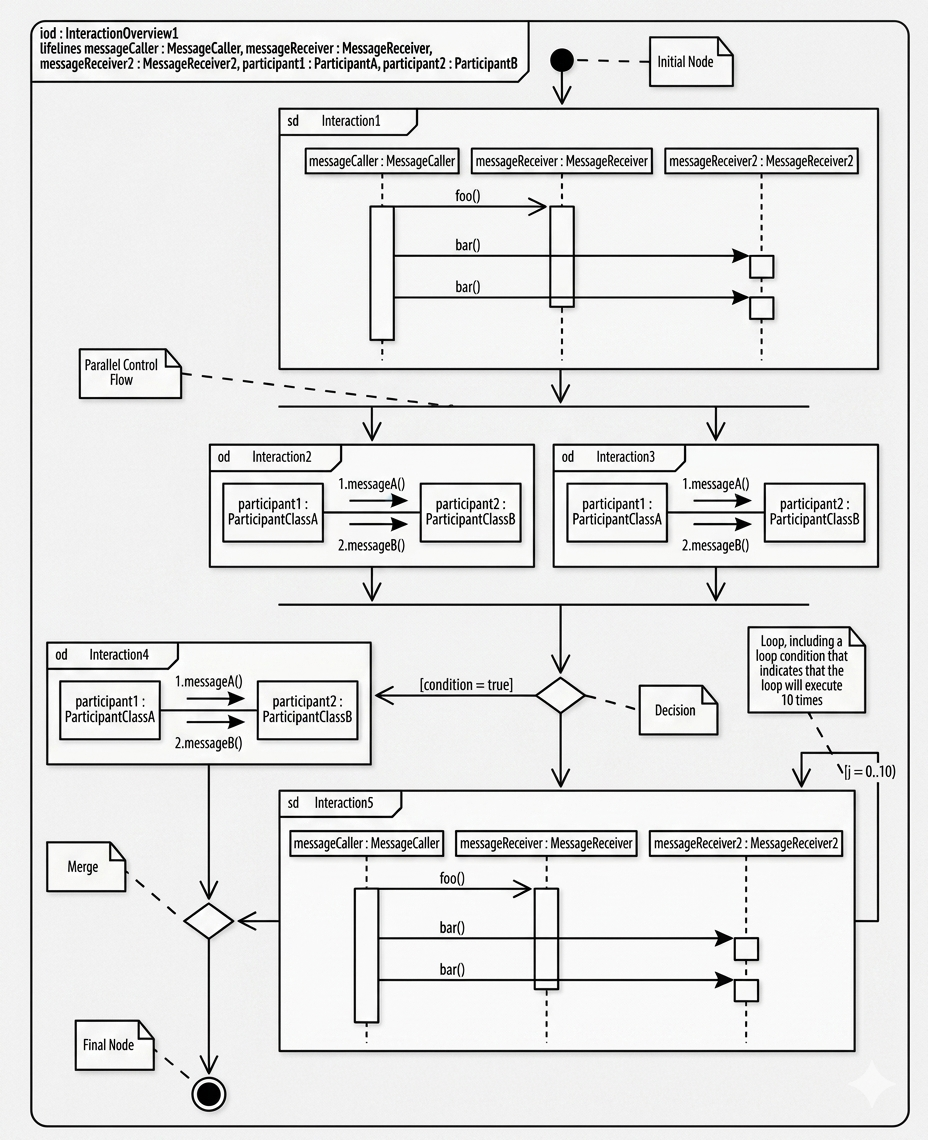
The process begins at the top right with the Initial Node (a solid black circle). A dashed line indicates the start of the control flow, leading directly into the first major interaction.
The flow enters a block labeled sd Interaction 1.
Type: This is a Sequence Diagram.
Function: It details a specific exchange between three lifelines: messageCaller, messageReceiver, and messageReceiver2.
Detail: We see synchronous calls (foo()) and subsequent messages (bar()). The vertical activation bars show exactly when each object is busy processing these requests.
After Interaction 1 completes, the control flow hits a thick horizontal bar known as a Fork Node. This splits the process into two simultaneous paths:
Path A (Interaction 2): A Communication Diagram (cd) showing participant1 and participant2 exchanging messages (messageA, messageB).
Path B (Interaction 3): An identical Communication Diagram structure running in parallel.
Once both parallel interactions are complete, the flow hits a Join Node (the second thick bar), synchronizing the threads back into a single control flow.
The flow then arrives at a Decision Node (a diamond shape). Here, the path diverges based on a condition:
The "True" Path: If the condition [condition = true] is met, the flow moves left to Interaction 4. This is another Communication Diagram.
The Loop Path: If the condition is not met (or as part of a looping structure), the flow moves downward to Interaction 5 (a Sequence Diagram).
The Loop Condition: A note indicates a loop condition \i = 0..10. This signifies that Interaction 5 will execute repeatedly—specifically 10 times—before the loop terminates. An arrow curves back from the bottom of Interaction 5 up to the decision point, visually representing this repetition.
After the loop completes (or the specific branch finishes), the flow reaches a Merge Node (another diamond). This combines the paths back together. Finally, the flow leads to the Final Node (a bullseye symbol at the bottom left), indicating that the entire use case or process has successfully concluded.
The primary advantage of the Interaction Overview Diagram is modularity. Instead of creating one massive, unreadable sequence diagram that spans hundreds of steps, you can decompose the system.
Deconstructing Complexity: You can break a large process (like "Create a New Regular Blog") into smaller chunks (e.g., "Select Account Type," "Enter Author Details," "Check Details").
Choosing the Right Tool for the Job: As seen in the example, you can mix diagram types based on what is most important for that specific step:
Use Sequence Diagrams when the order of messages is critical.
Use Communication Diagrams when the structural relationship between objects is the focus.
Use Timing Diagrams (as mentioned in the text regarding "Check Author Details") when strict time constraints (e.g., "must execute within 5 seconds") are the priority.
High-Level Logic: It allows stakeholders to understand the "big picture" logic—loops, parallel tasks, and decisions—without getting bogged down in the syntax of every single method call immediately.
To put this into a real-world context, imagine modeling a "Create a New Regular Blog" use case.
Step 1: You might start with a Sequence Diagram to handle the initial login and account selection.
Step 2: You might use a Parallel Flow to simultaneously validate the user's credentials and check database availability.
Step 3: You might use a Loop to retry a connection if the database is temporarily unavailable.
Step 4: Finally, you use a Sequence Diagram to finalize the blog creation.
The Interaction Overview Diagram ties all these distinct technical views into a single, coherent narrative.
The UML Interaction Overview Diagram is an essential tool for the modern software architect. It bridges the gap between abstract process flows and concrete implementation details. By allowing modelers to "zoom in" and "zoom out" of specific interactions, it ensures that complex systems remain understandable, maintainable, and logically sound. Whether you are dealing with strict timing constraints, parallel processing, or complex loops, this diagram type provides the flexibility needed to model system behavior with precision and clarity.

