
The Solution Selection Matrix is a structured decision-making framework designed to bridge the gap between Root Cause Analysis (RCA) and Actionable Implementation. While tools like Fishbone diagrams identify why a problem exists, the Selection Matrix determines how to fix it efficiently by evaluating potential solutions against specific business criteria.
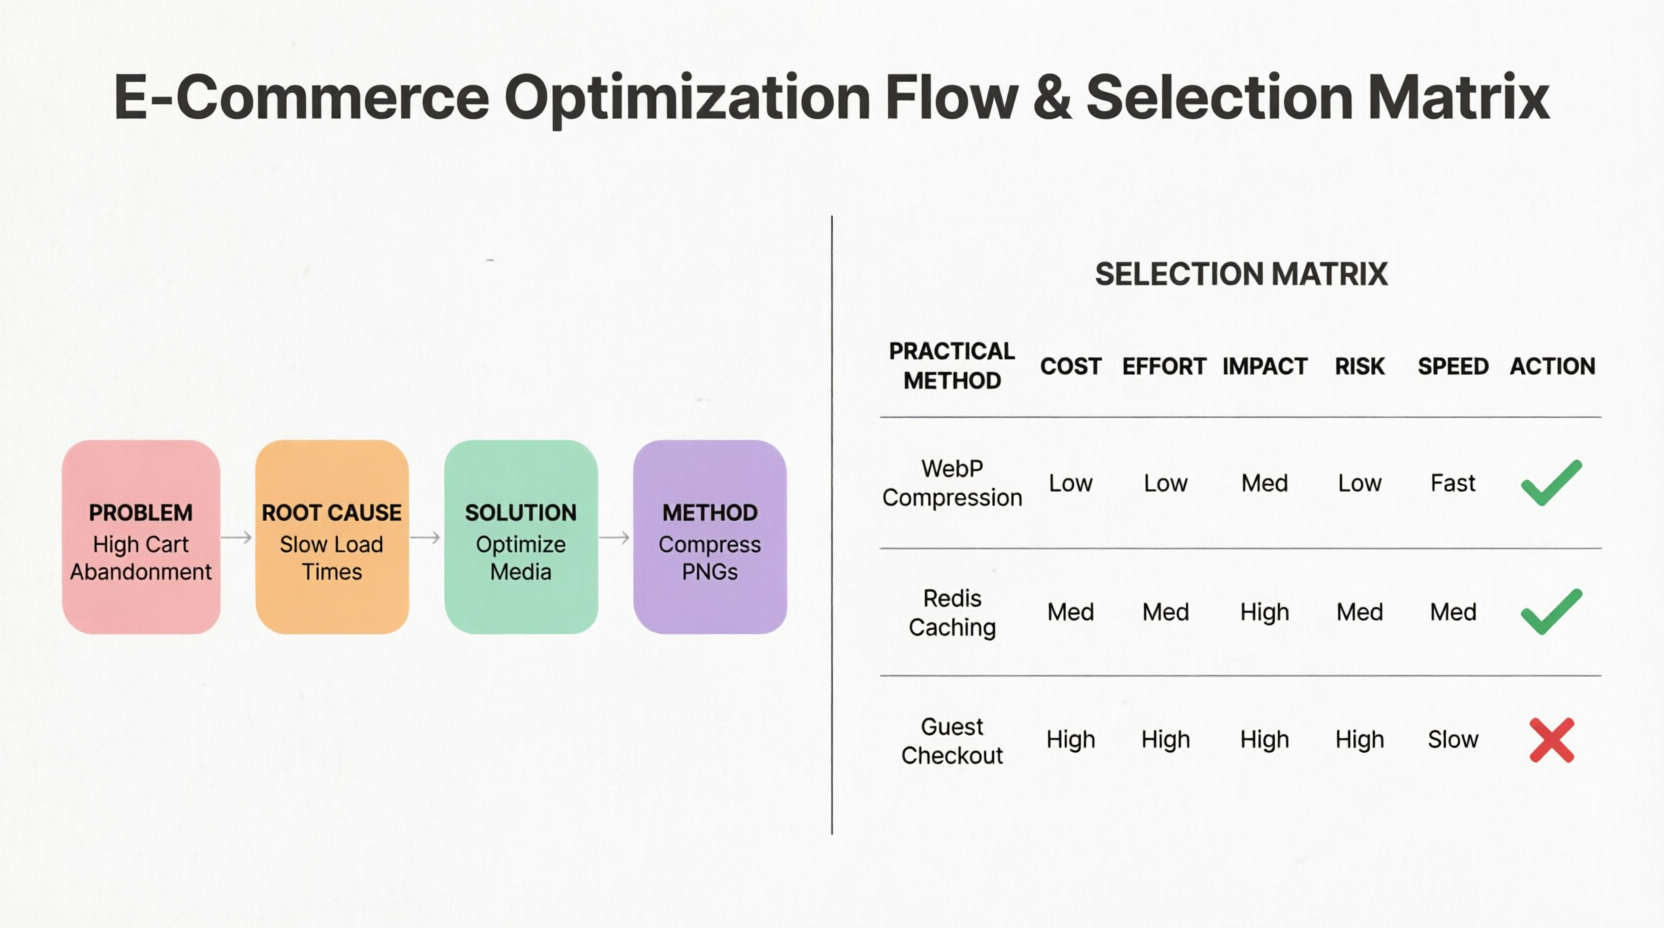
This guide utilizes a hierarchical flow (Problem → Cause → Solution → Method) combined with a weighted evaluation table to prioritize actions. Below are the ready-to-use PlantUML templates to generate this visualization.
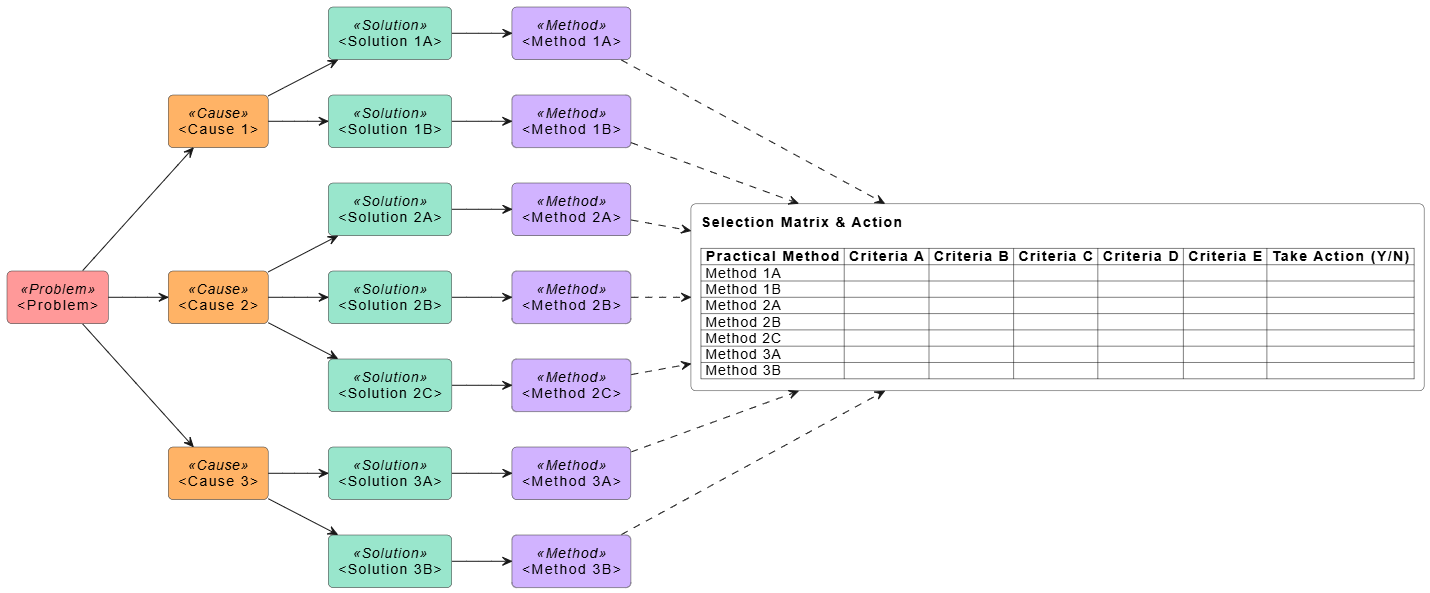
Use this code as a starting point for your own workshops. It establishes the color-coded hierarchy and an empty evaluation matrix.
@startuml
left to right direction
skinparam RectangleBackgroundColor white
skinparam RectangleBorderColor #333333
skinparam RoundCorner 10

' Define color palette matching the visual standard
!define PINK_COLOR #FF9999
!define ORANGE_COLOR #FFB366
!define GREEN_COLOR #99E6CC
!define PURPLE_COLOR #D1B3FF

' Styles for different node types
skinparam rectangle {
    BackgroundColor<<Problem>> PINK_COLOR
    BackgroundColor<<Cause>> ORANGE_COLOR
    BackgroundColor<<Solution>> GREEN_COLOR
    BackgroundColor<<Method>> PURPLE_COLOR
}

' --- ROOT PROBLEM ---
rectangle "<Problem>" <<Problem>> as Problem

' --- ROOT CAUSES ---
rectangle "<Cause 1>" <<Cause>> as Cause1
rectangle "<Cause 2>" <<Cause>> as Cause2
rectangle "<Cause 3>" <<Cause>> as Cause3

' --- SOLUTIONS & METHODS (CAUSE 1) ---
rectangle "<Solution 1A>" <<Solution>> as Sol1A
rectangle "<Method 1A>" <<Method>> as Met1A
rectangle "<Solution 1B>" <<Solution>> as Sol1B
rectangle "<Method 1B>" <<Method>> as Met1B

' --- SOLUTIONS & METHODS (CAUSE 2) ---
rectangle "<Solution 2A>" <<Solution>> as Sol2A
rectangle "<Method 2A>" <<Method>> as Met2A
rectangle "<Solution 2B>" <<Solution>> as Sol2B
rectangle "<Method 2B>" <<Method>> as Met2B
rectangle "<Solution 2C>" <<Solution>> as Sol2C
rectangle "<Method 2C>" <<Method>> as Met2C

' --- SOLUTIONS & METHODS (CAUSE 3) ---
rectangle "<Solution 3A>" <<Solution>> as Sol3A
rectangle "<Method 3A>" <<Method>> as Met3A
rectangle "<Solution 3B>" <<Solution>> as Sol3B
rectangle "<Method 3B>" <<Method>> as Met3B

' --- SELECTION MATRIX ---
rectangle Matrix [
<b>Selection Matrix & Action</b>

|= Practical Method |= Criteria A |= Criteria B |= Criteria C |= Criteria D |= Criteria E |= Take Action (Y/N) |
| Method 1A | | | | | | |
| Method 1B | | | | | | |
| Method 2A | | | | | | |
| Method 2B | | | | | | |
| Method 2C | | | | | | |
| Method 3A | | | | | | |
| Method 3B | | | | | | |
]

' --- HIERARCHY CONNECTIONS ---
Problem --> Cause1
Problem --> Cause2
Problem --> Cause3

Cause1 --> Sol1A
Sol1A --> Met1A
Cause1 --> Sol1B
Sol1B --> Met1B

Cause2 --> Sol2A
Sol2A --> Met2A
Cause2 --> Sol2B
Sol2B --> Met2B
Cause2 --> Sol2C
Sol2C --> Met2C

Cause3 --> Sol3A
Sol3A --> Met3A
Cause3 --> Sol3B
Sol3B --> Met3B

' Connect methods to the matrix for evaluation
Met1A ..> Matrix
Met1B ..> Matrix
Met2A ..> Matrix
Met2B ..> Matrix
Met2C ..> Matrix
Met3A ..> Matrix
Met3B ..> Matrix

@enduml
The diagram follows a strict four-tier logic designed to prevent "solution jumping" (trying to fix a symptom without addressing the root).
| Tier | Node Type | Color Code | Definition | Example |
|---|---|---|---|---|
| 1 | Problem | 🟥 Pink | The measurable pain point or negative metric requiring intervention. | High Shopping Cart Abandonment Rate (45%) |
| 2 | Cause | 🟧 Orange | The underlying reason contributing to the problem. Derived from RCA. | Slow Page Load Times |
| 3 | Solution | 🟩 Green | The strategic approach or high-level fix for the cause. | Optimize Media Assets |
| 4 | Method | 🟪 Purple | The specific, tactical execution step. This is what gets evaluated in the matrix. | Compress PNGs to WebP |
In the example below, five standard criteria are used to score the Methods:
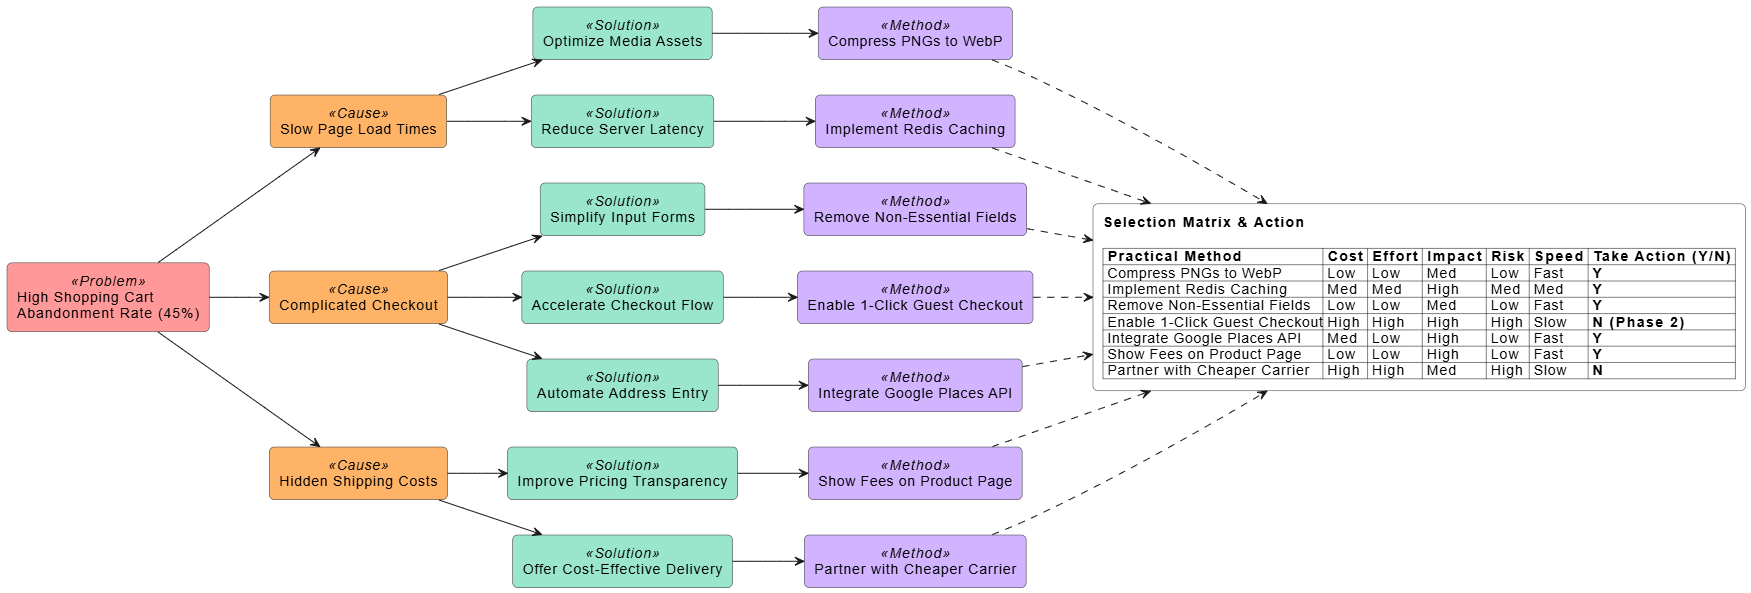
Scenario: An online retailer faces a 45% cart abandonment rate. Using the Solution Selection Matrix, the team moves from diagnosis to a prioritized backlog.
This code generates the fully populated case study diagram.
@startuml
left to right direction
skinparam RectangleBackgroundColor white
skinparam RectangleBorderColor #333333
skinparam RoundCorner 10

' Define color palette
!define PINK_COLOR #FF9999
!define ORANGE_COLOR #FFB366
!define GREEN_COLOR #99E6CC
!define PURPLE_COLOR #D1B3FF

' Styles for different node types
skinparam rectangle {
    BackgroundColor<<Problem>> PINK_COLOR
    BackgroundColor<<Cause>> ORANGE_COLOR
    BackgroundColor<<Solution>> GREEN_COLOR
    BackgroundColor<<Method>> PURPLE_COLOR
}

' Root Problem
rectangle "High Shopping Cart\nAbandonment Rate (45%)" <<Problem>> as Problem

' Root Causes
rectangle "Slow Page Load Times" <<Cause>> as Cause1
rectangle "Complicated Checkout" <<Cause>> as Cause2
rectangle "Hidden Shipping Costs" <<Cause>> as Cause3

' Solutions & Methods for Cause 1
rectangle "Optimize Media Assets" <<Solution>> as Sol1A
rectangle "Compress PNGs to WebP" <<Method>> as Met1A
rectangle "Reduce Server Latency" <<Solution>> as Sol1B
rectangle "Implement Redis Caching" <<Method>> as Met1B

' Solutions & Methods for Cause 2
rectangle "Simplify Input Forms" <<Solution>> as Sol2A
rectangle "Remove Non-Essential Fields" <<Method>> as Met2A
rectangle "Accelerate Checkout Flow" <<Solution>> as Sol2B
rectangle "Enable 1-Click Guest Checkout" <<Method>> as Met2B
rectangle "Automate Address Entry" <<Solution>> as Sol2C
rectangle "Integrate Google Places API" <<Method>> as Met2C

' Solutions & Methods for Cause 3
rectangle "Improve Pricing Transparency" <<Solution>> as Sol3A
rectangle "Show Fees on Product Page" <<Method>> as Met3A
rectangle "Offer Cost-Effective Delivery" <<Solution>> as Sol3B
rectangle "Partner with Cheaper Carrier" <<Method>> as Met3B

' Matrix Representation
rectangle Matrix [
<b>Selection Matrix & Action</b>

|= Practical Method |= Cost |= Effort |= Impact |= Risk |= Speed |= Take Action (Y/N) |
| Compress PNGs to WebP | Low | Low | Med | Low | Fast | **Y** |
| Implement Redis Caching | Med | Med | High | Med | Med | **Y** |
| Remove Non-Essential Fields| Low | Low | Med | Low | Fast | **Y** |
| Enable 1-Click Guest Checkout| High| High| High | High| Slow | **N (Phase 2)** |
| Integrate Google Places API| Med | Low | High | Low | Fast | **Y** |
| Show Fees on Product Page | Low | Low | High | Low | Fast | **Y** |
| Partner with Cheaper Carrier| High| High| Med | High| Slow | **N** |
]

' Hierarchy Connections
Problem --> Cause1
Problem --> Cause2
Problem --> Cause3

Cause1 --> Sol1A
Sol1A --> Met1A
Cause1 --> Sol1B
Sol1B --> Met1B

Cause2 --> Sol2A
Sol2A --> Met2A
Cause2 --> Sol2B
Sol2B --> Met2B
Cause2 --> Sol2C
Sol2C --> Met2C

Cause3 --> Sol3A
Sol3A --> Met3A
Cause3 --> Sol3B
Sol3B --> Met3B

' Connect the methods visually to the matrix block
Met1A ..> Matrix
Met1B ..> Matrix
Met2A ..> Matrix
Met2B ..> Matrix
Met2C ..> Matrix
Met3A ..> Matrix
Met3B ..> Matrix

@enduml
Instead of guessing, the team identifies three distinct causes:
For each cause, specific technical or operational methods are proposed.
The team evaluates the Methods (not just the Solutions) against the criteria.
| Practical Method | Cost | Effort | Impact | Risk | Speed | Decision | Rationale |
|---|---|---|---|---|---|---|---|
| Compress PNGs to WebP | Low | Low | Med | Low | Fast | ✅ Y | Quick win. Low risk, immediate performance boost. |
| Implement Redis Caching | Med | Med | High | Med | Med | ✅ Y | Higher effort but critical for scalability. Worth the investment. |
| Remove Non-Essential Fields | Low | Low | Med | Low | Fast | ✅ Y | Pure UX fix. Removes friction instantly. |
| 1-Click Guest Checkout | High | High | High | High | Slow | ️ N (Phase 2) | High impact but requires security overhaul. Too risky for immediate sprint. |
| Integrate Google Places API | Med | Low | High | Low | Fast | ✅ Y | Reduces typing effort significantly. Good ROI. |
| Show Fees on Product Page | Low | Low | High | Low | Fast | ✅ Y | Builds trust early. Prevents "sticker shock" at checkout. |
| Partner with Cheaper Carrier | High | High | Med | High | Slow | ❌ N | High risk to delivery quality. Savings don't outweigh brand damage. |
Cost, Effort, etc., in the Salt table header with criteria relevant to your domain (e.g., for Software: Security, Scalability, Maintainability; for HR: Employee Satisfaction, Retention, Compliance).Expanding Causes: The template supports N causes. Simply duplicate the Cause --> Solution --> Method block structure in the PlantUML code.

