
Understanding how software components interact over time is fundamental to designing robust, predictable systems. The Unified Modeling Language (UML) offers several interaction diagrams to visualize these dynamics, with Timing Diagrams and Sequence Diagrams serving complementary yet distinct purposes. While both depict object behavior and message flow, they emphasize different aspects of system execution: one focuses on state duration and temporal constraints, the other on the chronological order of interactions.
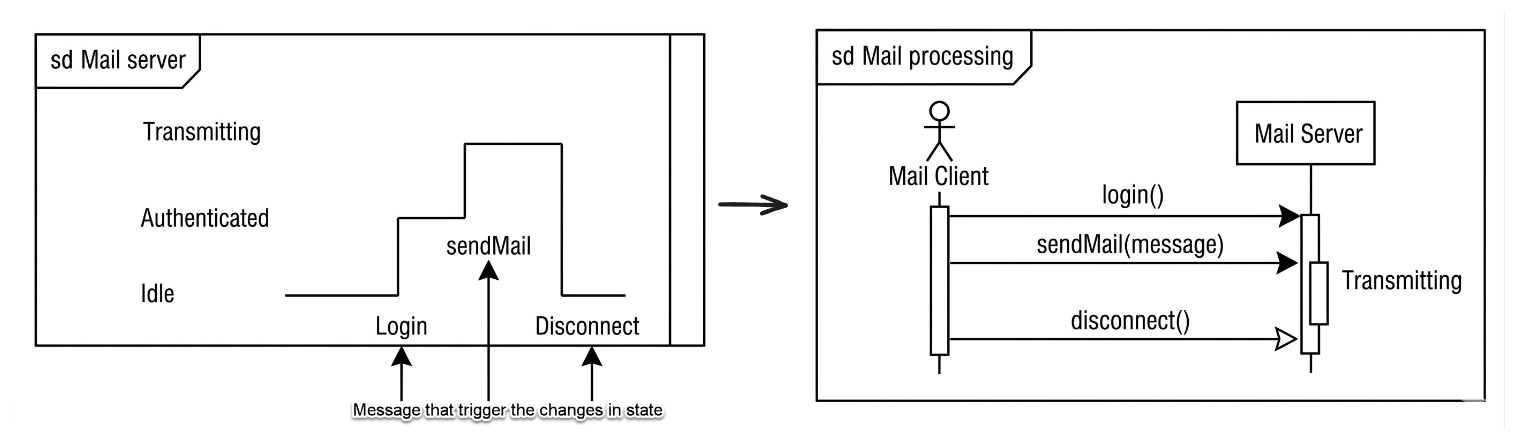
This guide provides a comprehensive, practical exploration of both diagram types using a real-world Mail Server scenario. Whether you are modeling authentication flows, data transmission protocols, or system teardown sequences, you will learn how to select the right diagram, interpret its notation, and apply it effectively to communicate design intent to developers, architects, and stakeholders.
A UML Timing Diagram is an interaction diagram that emphasizes how the state of an object changes over a specific timeframe. Unlike other UML diagrams that prioritize message ordering, timing diagrams explicitly represent:
The duration an object remains in a given state
The precise moments when state transitions occur
Temporal constraints and deadlines that govern behavior
This makes timing diagrams especially valuable for real-time systems, protocol specifications, and performance-critical components where timing guarantees matter.
Using our Mail Server example, a timing diagram includes three essential elements:
Represents the entity whose behavior is being tracked—in this case, :MailServer
Appears as a horizontal or vertical axis along which state changes are plotted
Serves as the reference frame for all temporal observations
Vertical axis: Lists discrete, mutually exclusive states such as Idle, Authenticated, and Transmitting
Horizontal axis: Represents the progression of time (linear, not necessarily scaled to real-world units unless specified)
State transitions are shown as steps or slopes connecting timeline segments
External triggers that cause state changes: Login, sendMail, Disconnect
Depicted as labeled arrows or markers intersecting the lifeline at the moment of occurrence
May include guard conditions or timing constraints (e.g., "Login must complete within 2s")
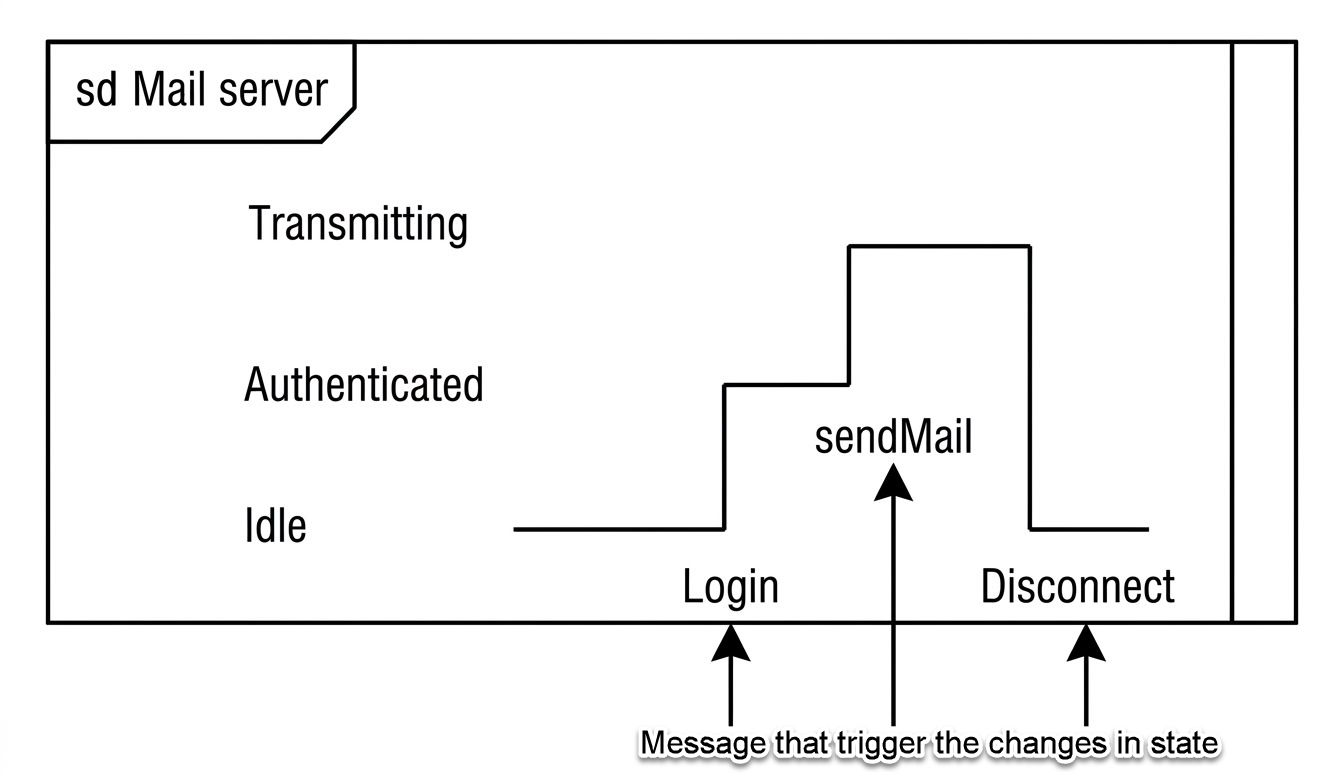
The Mail Server begins in Idle, awaiting authentication
Upon receiving Login, it transitions to Authenticated
The sendMail event triggers entry into Transmitting
Disconnect returns the server to Idle, completing the cycle
Choose a timing diagram when your design questions include:
How long does the system remain in a critical state?
Are there hard deadlines for state transitions?
Does the order of events matter less than their temporal spacing?
Do you need to verify timeout behaviors or synchronization windows?
A UML Sequence Diagram models interactions between objects or actors in chronological order, emphasizing the flow of messages rather than state duration. It answers: "Who sends what to whom, and in what sequence?"
Sequence diagrams are ideal for illustrating use case realizations, API contracts, and high-level workflow logic where the focus is on collaboration, not timing precision.
In the Mail Server scenario, the diagram features:
Vertical dashed lines descending from participants: User (actor) and :MailServer (system object)
Represent the existence of each participant over the interaction timeline
Horizontal arrows indicating method calls, signals, or data transfers
Labeled with operation names: Login(), sendMail(), Disconnect()
May be synchronous (solid arrowhead) or asynchronous (open arrowhead)
Thin rectangles overlaid on lifelines
Indicate periods when an object is actively executing an operation
Help visualize nested calls, recursion, or concurrent processing
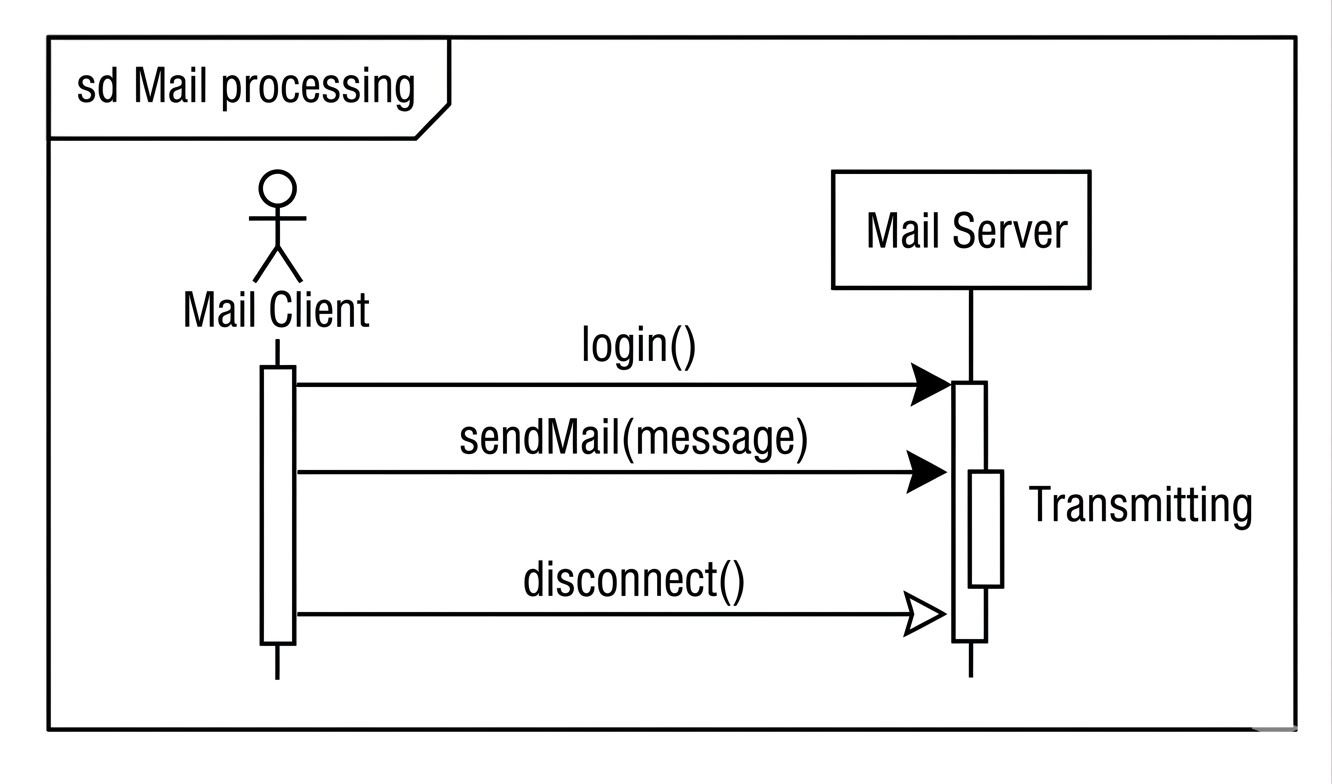
Step-by-step interpretation:
Login: User initiates authentication; Mail Server validates credentials and enters an active processing state
sendMail: User requests message delivery; Mail Server processes and transmits the payload
Disconnect: User terminates session; Mail Server releases resources and returns to idle
Opt for a sequence diagram when you need to:
Clarify the order of operations across multiple components
Document API usage patterns or service contracts
Onboard new team members with a visual workflow
Identify missing messages or unexpected dependencies in a use case
| Aspect | Timing Diagram | Sequence Diagram |
|---|---|---|
| Primary Focus | Duration and timing of states | Order and flow of messages |
| Time Representation | Explicit axis with measurable intervals | Implicit chronological progression |
| State Visibility | States are first-class elements | States are implied via activation bars |
| Best For | Real-time constraints, protocol timing | Use case flows, API interactions |
| Complexity Handling | Excellent for single-object temporal logic | Excellent for multi-object collaboration |
| Notation Emphasis | State timelines, duration constraints | Message arrows, activation fragments |
These diagrams are not mutually exclusive. In practice:
Use a sequence diagram early in design to map out what interactions occur
Use a timing diagram later to refine when and for how long critical states persist
Combine both in system specifications to provide complete behavioral coverage
For the Mail Server:
The sequence diagram clarifies that Login must precede sendMail
The timing diagram ensures that authentication completes within an acceptable window before transmission begins
Add timing constraints: Annotate transitions with deadlines (e.g., "Login ≤ 2000ms")
Include time scales: Define units (ms, s) when real-time behavior matters
Model concurrent states: Use parallel timelines for multi-threaded or distributed components
Specify invariants: Note conditions that must hold throughout a state (e.g., "Authenticated: session token valid")
Use combined fragments: Represent loops (loop), alternatives (alt), and parallel execution (par)
Clarify return values: Add dashed return arrows with result annotations
Group related messages: Use interaction occurrences to reference other diagrams or subsystems
Label activation depth: Show nested calls to illustrate call stack behavior
VisualParadigm, Lucidchart, and PlantUML support both diagram types
Export diagrams as SVG or PNG for documentation; embed interactive versions in wikis for team collaboration
Version-control diagram source files (e.g., PlantUML .puml) alongside code for traceability
Timing and Sequence Diagrams are powerful, complementary tools in the UML toolkit—each illuminating a different dimension of system behavior. The Timing Diagram excels at revealing how long an object resides in a state and when transitions must occur, making it indispensable for performance-sensitive or real-time designs. The Sequence Diagram, by contrast, clarifies who interacts with whom and in what order, offering an intuitive view of collaborative workflows.
By applying both to the Mail Server example, we see how a single use case can be analyzed through multiple lenses: one focused on temporal precision, the other on interaction logic. As systems grow more complex and distributed, the ability to model both dimensions becomes not just useful, but essential.
Start with the question you need to answer: Is it about order, or about duration? Let that guide your choice of diagram. And remember—great models don't just document; they communicate, validate, and elevate the entire development process. With practice, you'll wield these diagrams not as academic exercises, but as living artifacts that drive better design, clearer requirements, and more resilient software.

