Introduction
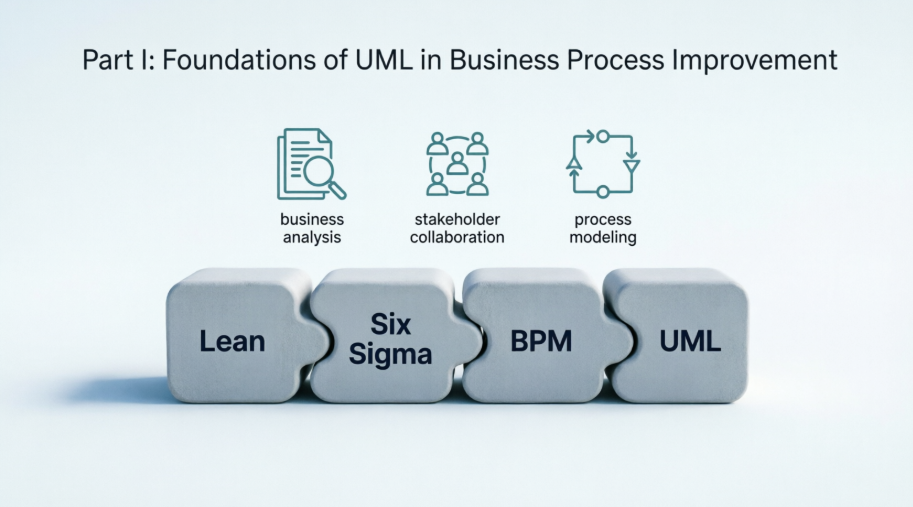
Business Process Improvement (BPI) is no longer a periodic exercise; it is a continuous discipline required to remain competitive, compliant, and resilient. While methodologies like Lean, Six Sigma, and BPMN-driven process management have long dominated the improvement landscape, they often fall short when processes intersect deeply with software systems, data architectures, or cross-functional organizational structures. This is where the Unified Modeling Language (UML) proves invaluable.
Originally conceived for software engineering, UML has evolved into a robust, standardized modeling language capable of capturing business workflows, system interactions, data structures, and organizational behaviors in a single coherent framework. When applied deliberately to BPI, UML bridges the gap between strategic intent, operational reality, and technical execution. This article distills a comprehensive framework for leveraging UML to analyze, redesign, and optimize business processes, offering practitioners a structured path from foundational concepts to advanced implementation.
Part I: Foundations of UML in Business Process Improvement
1. The Role of Modeling in BPI
Business Process Improvement relies on three core phases: understand (As-Is), analyze (identify waste, variation, bottlenecks), and redesign (To-Be). Modeling transforms implicit, tribal knowledge into explicit, shareable artifacts. Without visual representation, improvement initiatives risk misalignment, scope creep, and resistance to change. UML provides a standardized vocabulary that transcends departmental silos, enabling business analysts, process owners, and technical teams to collaborate on a single source of truth.
2. UML vs. BPMN: Complementary, Not Competing
BPMN excels at execution-ready process mapping and workflow automation. UML, by contrast, offers a broader systems-thinking lens. While BPMN focuses on what happens and when, UML excels at why it happens, who/what participates, how data and states evolve, and how processes integrate with IT architecture. In practice, organizations achieve the strongest outcomes by combining both: BPMN for execution and compliance tracking, UML for requirements traceability, system alignment, and architectural impact analysis.
3. Aligning UML with Business Analysis
UML integrates naturally with established business analysis practices. Stakeholder identification maps directly to actors and use cases. Requirements elicitation benefits from diagram-driven workshops that surface hidden assumptions. Process maturity models (e.g., CMMI, BPM Maturity) can be assessed by evaluating the consistency, versioning, and traceability of UML artifacts. When modeled rigorously, UML becomes the backbone of a requirements-to-implementation traceability matrix.
Part II: Core UML Diagrams for Business Processes
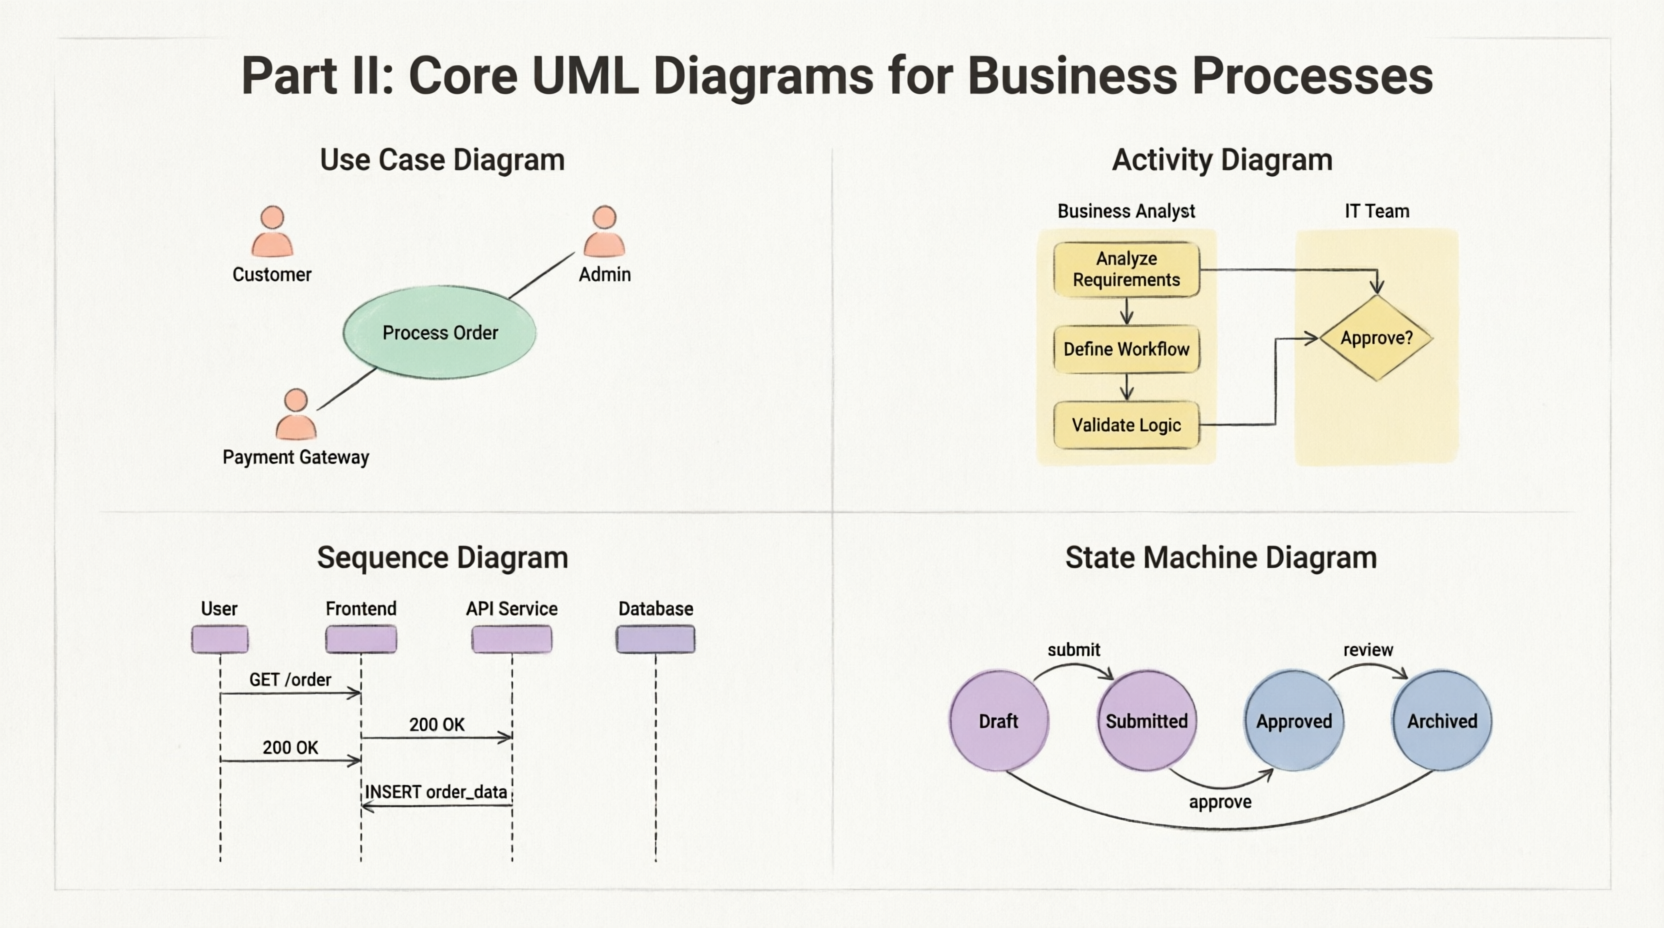
4. Use Case Diagrams: Defining Scope and Value
Use Case diagrams capture the functional boundary between actors (people, systems, external entities) and the process or system under improvement. They answer: What does this process deliver, to whom, and under what conditions?
- BPI Application: Identify redundant capabilities, missing stakeholder interactions, or scope ambiguity. Grouping use cases by value stream highlights improvement priorities.
- Best Practices: Keep descriptions outcome-focused. Avoid embedding UI or technical steps. Use
<<include>> and <<extend>> sparingly to prevent diagram clutter.
- Common Pitfall: Confusing organizational roles with system actors, leading to inflated scope.
5. Activity Diagrams: Mapping Workflows and Decisions
Activity diagrams are the workhorse of process modeling. They represent sequences, parallelism, decisions, merges, and exceptions. Swimlanes (partitions) map directly to roles, departments, or systems, making them ideal for RACI alignment.
- As-Is vs. To-Be Mapping: Overlay current-state inefficiencies (manual approvals, rework loops) with redesigned flows. Use object flows to track document/data movement.
- Advanced Features: Signals and exception handlers model real-world disruptions (e.g., system downtime, compliance blocks). Time events can simulate SLAs.
- BPI Value: Visually isolates non-value-added steps, handoff delays, and unnecessary branching.
6. Sequence & Communication Diagrams: Exposing Interaction Friction
While activity diagrams show workflow logic, sequence diagrams reveal the temporal and message-passing reality of cross-functional or system-to-system interactions.
- BPI Application: Identify bottlenecks in handoffs, synchronous blocking calls, or latency-prone integrations. Communication diagrams (collaboration diagrams) emphasize structural relationships over timing.
- Timing Analysis: Combine with performance baselines to model cycle time, queue depth, and timeout risks. Useful for SLA negotiation and automation scoping.
7. State Machine Diagrams: Managing Process Lifecycles
Not all processes are linear. Many are state-driven: orders, invoices, service tickets, compliance reviews, and employee onboarding.
- BPI Application: Model valid transitions, guard conditions, and terminal states. Reveals deadlocks, orphaned states, or missing audit trails.
- Compliance & Automation: State machines align naturally with RPA triggers, workflow engines, and regulatory checkpoint requirements. They provide unambiguous rules for status tracking and exception routing.
Part III: Supporting Models & Business Integration
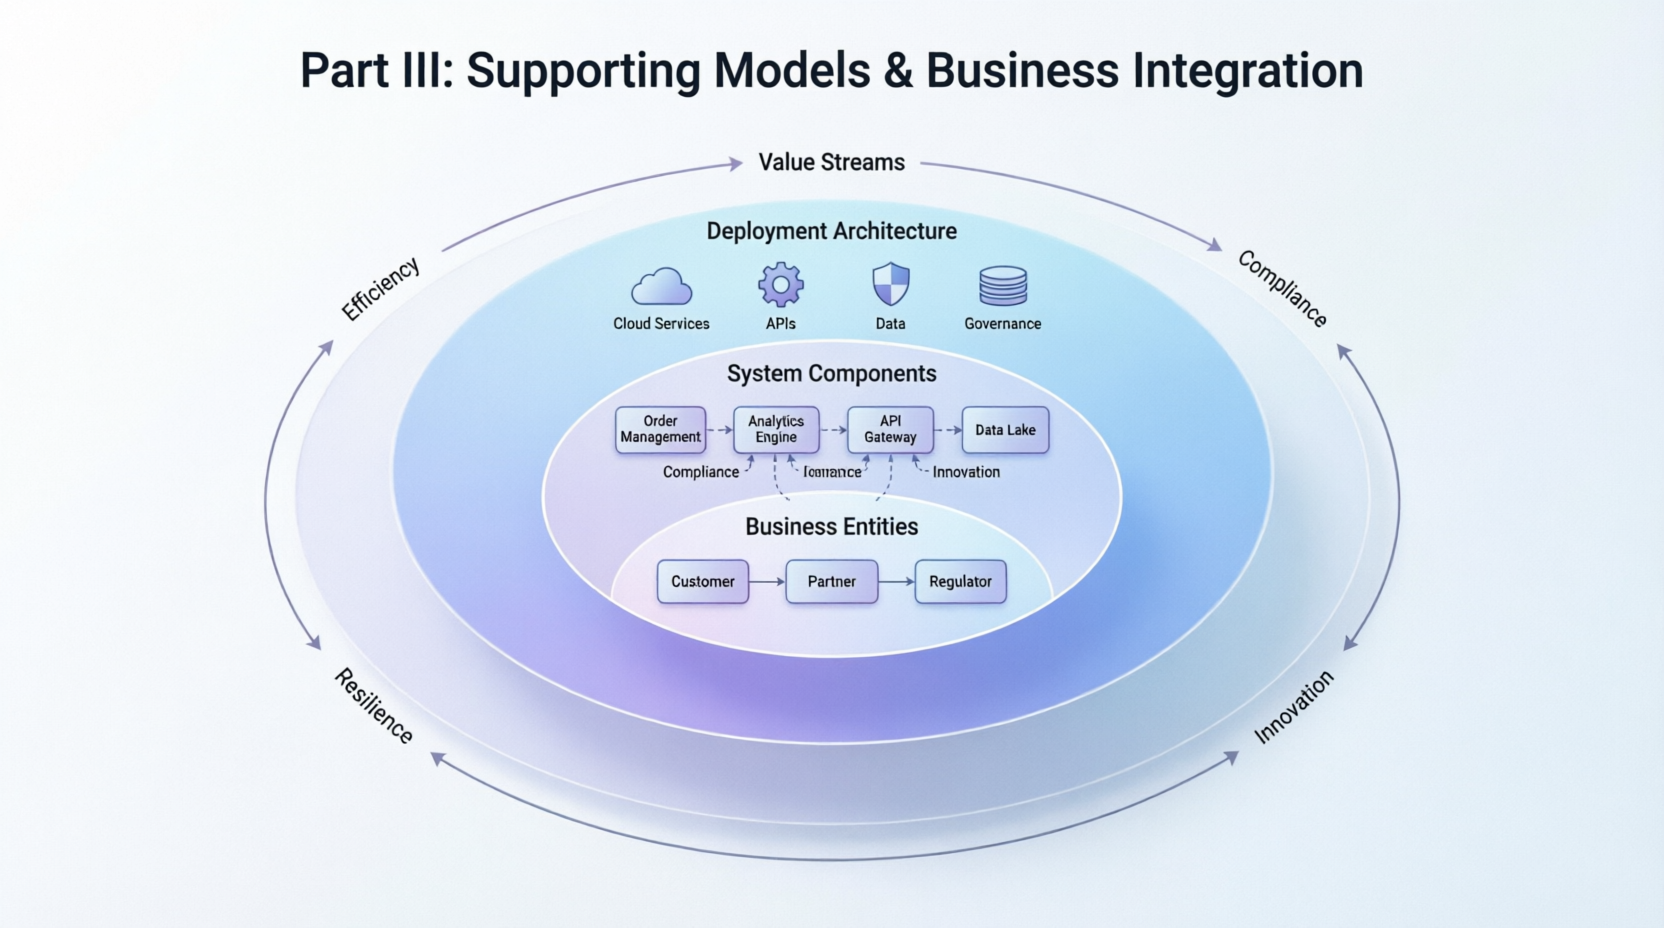
8. Class & Object Diagrams: Grounding Processes in Data
Processes don’t operate in a vacuum; they manipulate business entities. Class diagrams capture the conceptual data model: entities, attributes, relationships, and constraints.
- BPI Application: Ensure process redesign accounts for data availability, duplication, or governance gaps. Link activity/object flows to specific class instances to validate information architecture.
- Practical Tip: Keep diagrams at a conceptual level early in BPI. Refine to logical/physical models only when automation or system integration is scoped.
9. Integrating UML Across the Enterprise Architecture
Business processes live within broader ecosystems. UML’s structural and advanced behavioral diagrams provide necessary context:
- Component & Deployment Diagrams: Show which systems, services, or infrastructure host process steps. Critical for cloud migration, legacy retirement, or SaaS integration.
- Interaction Overview Diagrams: Combine activity and sequence perspectives for high-level process orchestration across departments or value streams.
- Composite Structure Diagrams: Model complex organizational or system boundaries, internal collaborations, and delegated responsibilities.
10. Extending UML for Business Contexts
UML is deliberately extensible. Through profiles and stereotypes, practitioners can tailor notation to business needs:
«Policy», «KPI», «Regulation», «SLA» stereotypes embed governance directly into models.- Integration with SIPOC, Value Stream Mapping, and Lean waste categories creates hybrid artifacts that speak to both operations and engineering.
- Traceability matrices link strategic objectives → value streams → processes → requirements → UML models → system components, ensuring improvement initiatives remain aligned with business goals.
Part IV: Practical Application and Improvement
11. UML-Based Process Analysis & Redesign
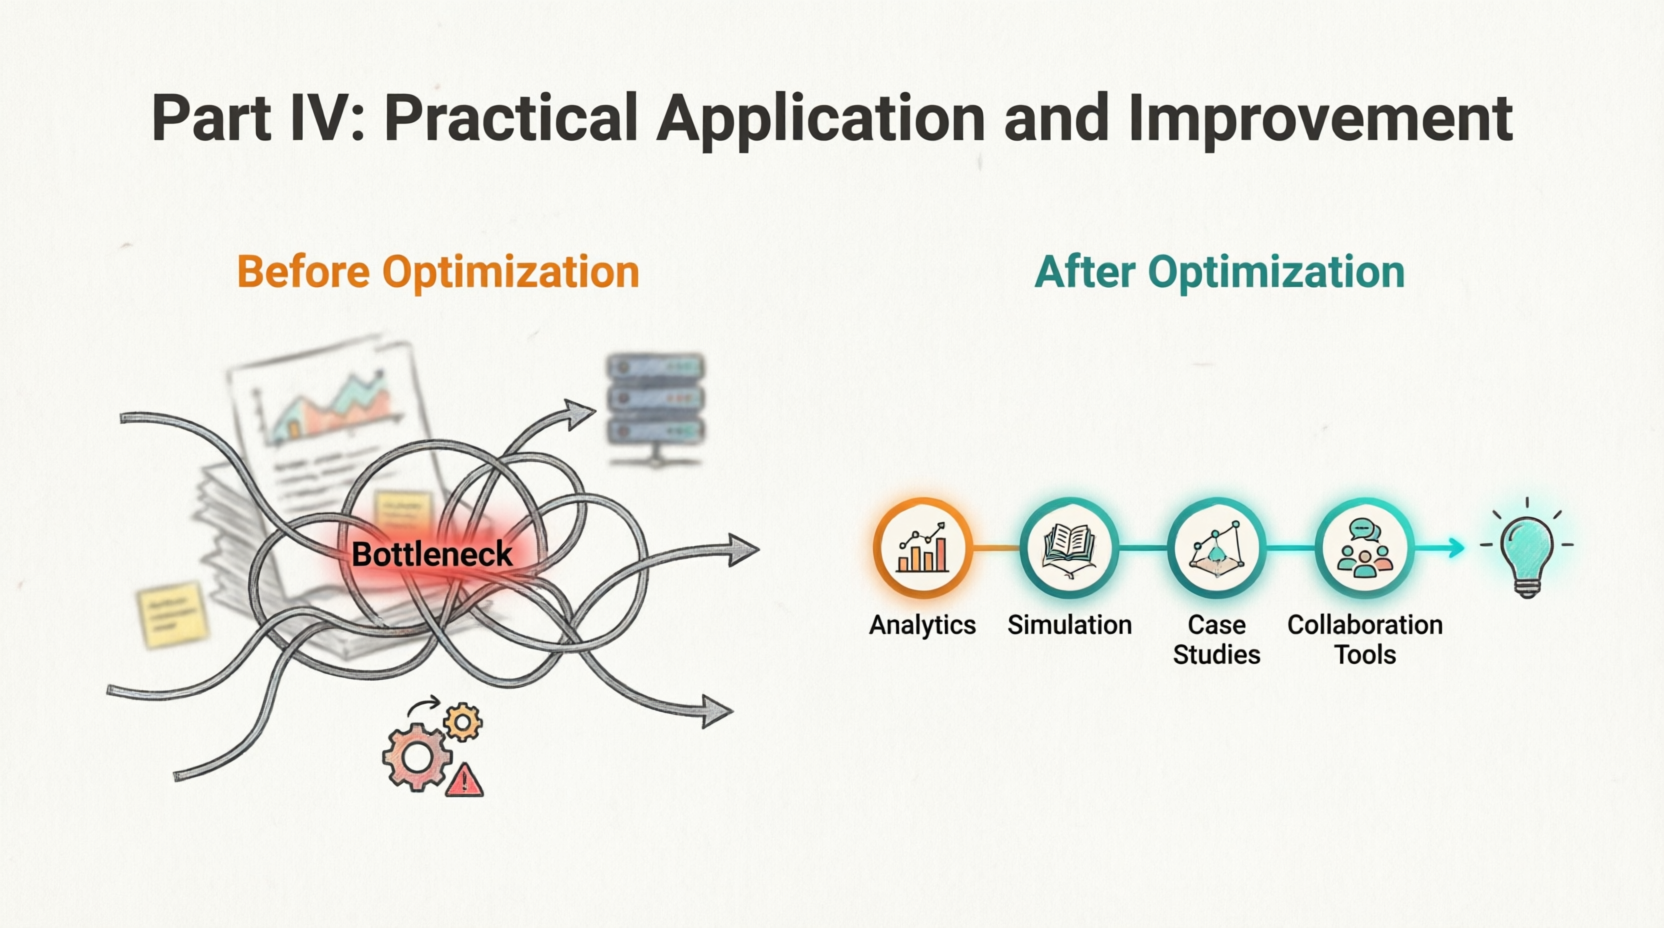
Once models are built, they become diagnostic tools:
- Waste Identification: Map non-value-added steps (transport, waiting, overprocessing) directly onto activity diagrams.
- Bottleneck Analysis: Use sequence diagrams to pinpoint synchronous dependencies, single points of failure, or resource contention.
- Simulation & Quantitative Analysis: Modern modeling tools support stochastic simulation, Monte Carlo cycle-time estimation, and throughput analysis. Models can be parameterized with arrival rates, service times, and error probabilities.
- Redesign Patterns: Parallelize independent paths, introduce exception lanes, consolidate approvals, automate data handoffs, and implement state guards to prevent rework.
12. Case Studies in Context
- Manufacturing/Supply Chain: Activity diagrams mapped procurement-to-delivery flows, revealing a 3-day inventory hold caused by manual PO matching. State machines standardized lot-tracking, reducing compliance deviations by 40%.
- Customer Onboarding: Use case diagrams clarified role boundaries between sales, compliance, and IT. Sequence diagrams exposed a 7-step manual KYC handoff; redesign cut onboarding time by 60%.
- Finance & Compliance: State-driven invoice approval workflows replaced email chains. Class diagrams aligned GL codes, cost centers, and audit trails, enabling automated reconciliation.
- Digital Transformation: UML served as the blueprint for legacy-to-cloud process migration. Component diagrams mapped decommissioned monoliths to microservices, ensuring zero process disruption during rollout.
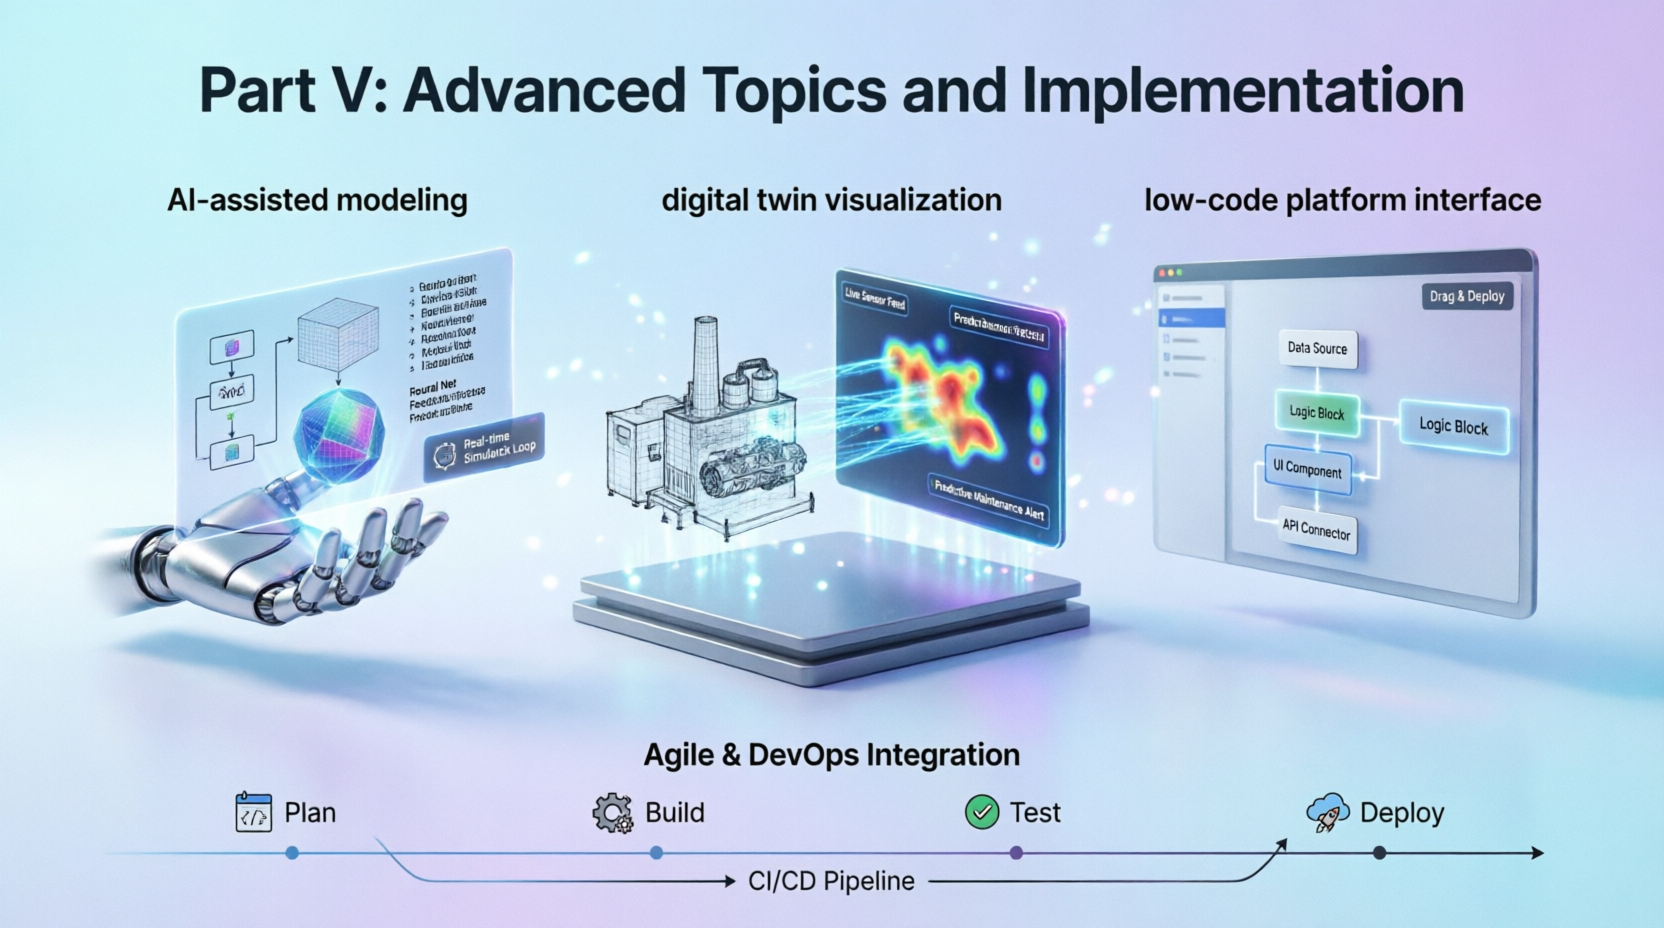
Part V: Advanced Topics and Implementation
13. Best Practices, Quality Assurance & Pitfalls
- Audience Alignment: Simplify notation for business stakeholders. Use glossaries, color coding, and layered views (executive → operational → technical).
- Validation: Cross-check models against process logs, system metrics, and stakeholder interviews. Run table-walkthroughs with frontline staff.
- Common Mistakes:
- Over-modeling: Diagrams become academic exercises rather than decision aids.
- Ignoring non-functional requirements: Performance, security, and compliance constraints must be explicit.
- Poor naming conventions: Ambiguous actors, inconsistent verb-noun use cases, or unlabeled transitions destroy clarity.
- Static modeling: Processes evolve; models must be updated or retired.
14. Future Trends: AI, Low-Code & Digital Twins
The next evolution of UML in BPI is already emerging:
- AI-Assisted Modeling: LLMs and process mining algorithms auto-generate draft diagrams from logs, transcripts, or system APIs. AI validates consistency, suggests optimization patterns, and detects anti-patterns.
- Low-Code/No-Code Consumption: Platforms increasingly accept UML imports to auto-generate workflows, data models, and UI scaffolds, accelerating time-to-value.
- Digital Twins & Simulation: UML models serve as the structural backbone for process digital twins, enabling real-time what-if analysis, predictive bottlenecking, and continuous optimization loops.
- Agile & DevOps Alignment: “Model-as-code,” CI/CD pipelines for business processes, and shift-left validation ensure UML remains relevant in fast-paced, iterative environments.
Conclusion: UML as a Strategic Asset for Process Excellence
UML is no longer confined to software architects. When applied with discipline and business context, it becomes a powerful catalyst for process improvement. It clarifies scope, exposes hidden friction, aligns cross-functional teams, and bridges the gap between operational workflows and technical implementation.
The key to success lies in balance: model enough to drive decisions, but not so much that agility suffers. Pair UML with Lean thinking, validate against real data, integrate with modern toolchains, and treat models as living artifacts. Organizations that master this approach don’t just improve processes; they build a continuous improvement engine capable of adapting to market shifts, regulatory changes, and technological disruption.
For Business Analysts, Process Improvement Specialists, Project Managers, and Enterprise Architects, UML is not just a notation—it’s a strategic lens. Start small. Map one critical value stream. Validate with stakeholders. Iterate. Over time, a disciplined UML practice will transform how your organization understands, optimizes, and scales its processes.
Quick Reference: UML Diagram Selection for BPI
| Business Need |
Recommended UML Diagram(s) |
Key BPI Output |
| Scope & stakeholder alignment |
Use Case |
Boundary definition, value mapping |
| Workflow & handoff analysis |
Activity (with swimlanes) |
Waste identification, To-Be redesign |
| Cross-system or role interaction timing |
Sequence / Communication |
Bottleneck detection, SLA validation |
| Lifecycle & compliance tracking |
State Machine |
Approval routing, audit trail design |
| Data & entity alignment |
Class / Object |
Information architecture validation |
| System & deployment context |
Component / Deployment |
IT impact analysis, migration planning |
| High-level orchestration |
Interaction Overview |
Value stream mapping, multi-process view |
By anchoring improvement initiatives in standardized, traceable, and simulation-ready models, organizations can move from reactive firefighting to proactive process excellence. UML provides the grammar; business discipline provides the purpose. Together, they deliver measurable, sustainable improvement.