Let’s address the elephant in the room: when many developers hear "UML" (Unified Modeling Language), they picture massive, outdated, 50-page documents created in clunky legacy software right before a waterfall release.
That version of UML is dead. But modern UML is alive and well. Today, it’s not about creating perfect, exhaustive blueprints; it’s about sketching ideas, aligning teams, and untangling complex logic before you write a single line of code.
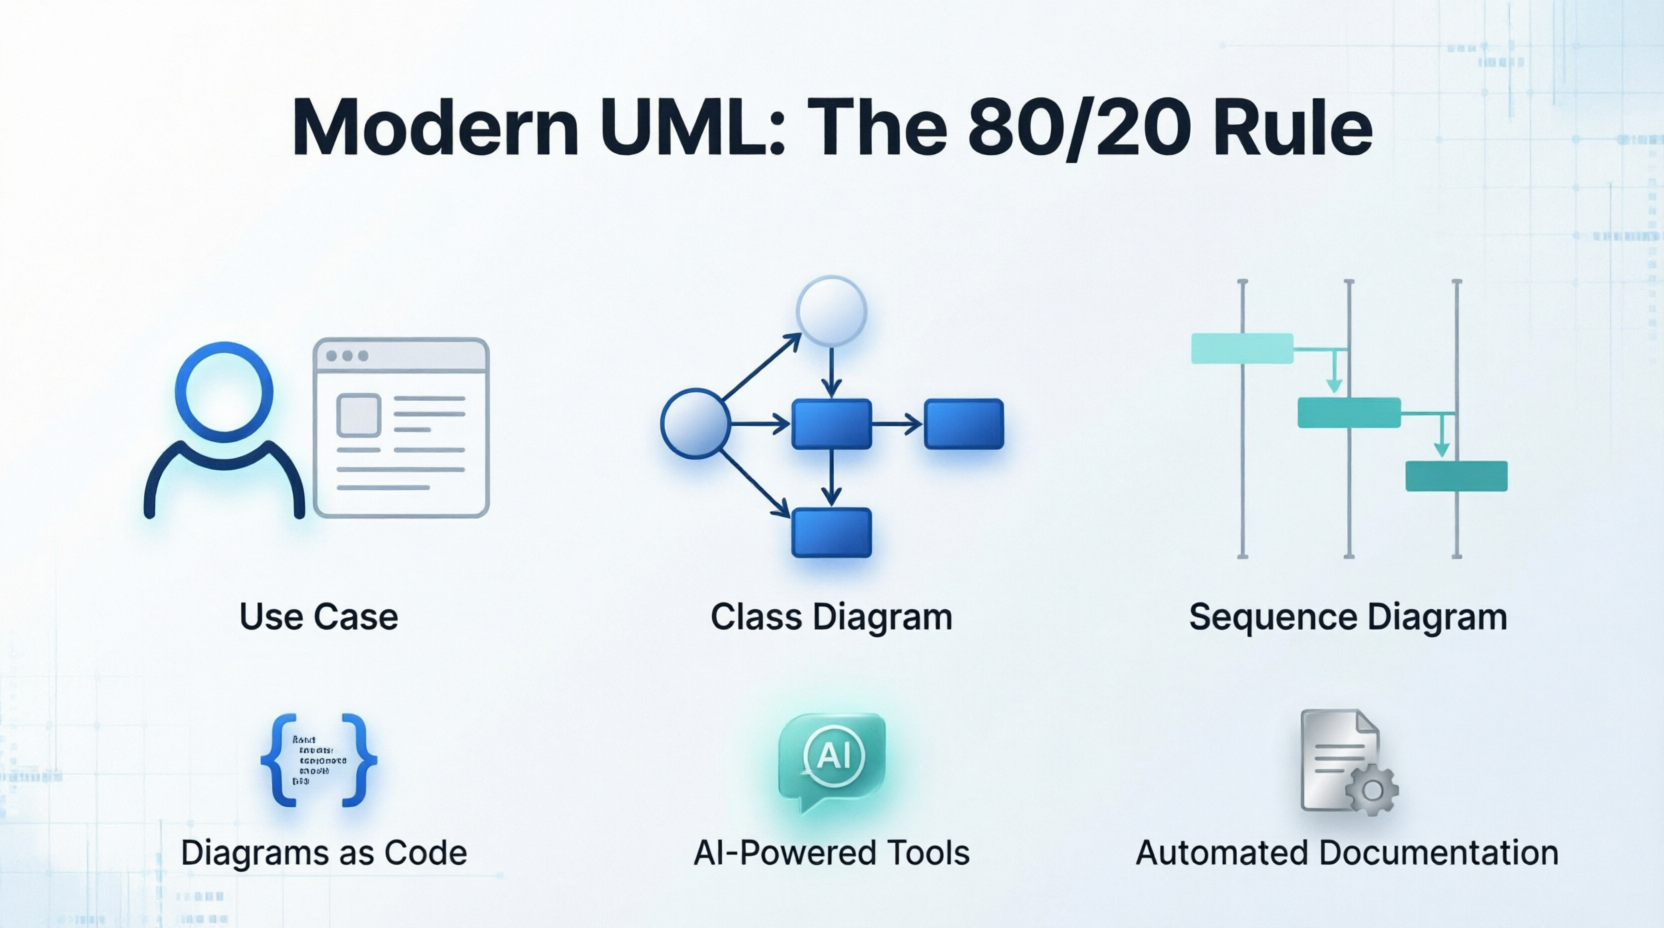
This guide will teach you the "no-bloat" approach to UML, focusing only on the concepts that deliver 80% of the value with 20% of the effort.
Before drawing a single box, adopt these three modern UML principles:
UML has 14 different diagram types. You only need to master three to handle almost any software design conversation.
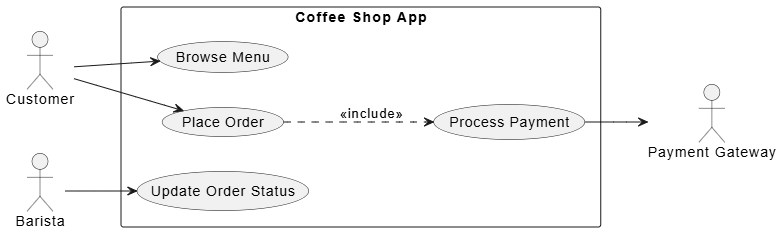
Purpose: To define the system’s boundaries and show what external actors (users or other systems) can do.
Key Concepts:
Example: A Simple Coffee Shop App
@startuml
left to right direction

actor "Customer" as C
actor "Barista" as B
actor "Payment Gateway" as PG

rectangle "Coffee Shop App" {
  usecase "Browse Menu" as UC1
  usecase "Place Order" as UC2
  usecase "Process Payment" as UC3
  usecase "Update Order Status" as UC4
}

C --> UC1
C --> UC2
UC2 ..> UC3 : <<include>>
B --> UC4
UC3 --> PG
@enduml
PlantUML Tip: The left to right direction command prevents the diagram from becoming a tall, narrow column, making it much easier to read on standard monitors.
Takeaway: This instantly tells a new developer or stakeholder the scope of the app without a single line of technical jargon.
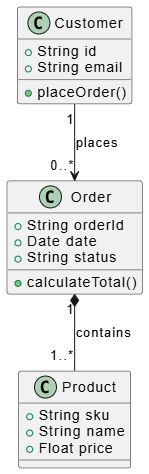
Purpose: To map out the data models, their attributes, and how they relate to each other. It’s the closest UML gets to actual code.
Key Concepts:
Example: E-Commerce Data Model
@startuml

class Customer {
  + String id
  + String email
  + placeOrder()
}

class Order {
  + String orderId
  + Date date
  + String status
  + calculateTotal()
}

class Product {
  + String sku
  + String name
  + Float price
}

Customer "1" --> "0..*" Order : places
Order "1" *-- "1..*" Product : contains

@enduml
PlantUML Tip: The + symbol denotes public visibility. You can use - for private or # for protected to add precise technical detail without cluttering the visual layout.
Takeaway: Notice the *-- arrow? That’s composition. It visually communicates a crucial business rule: an order cannot exist without products.
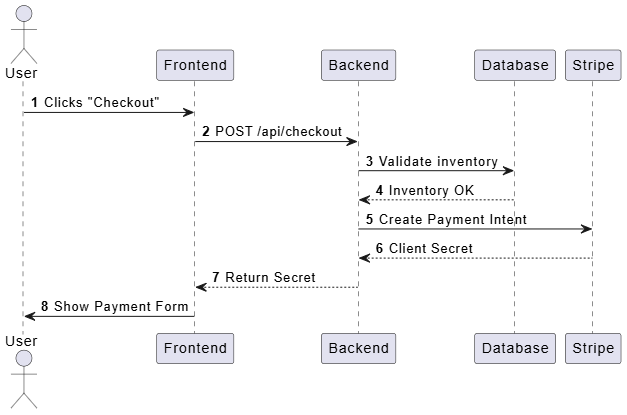
Purpose: To show how objects interact over time to complete a specific task. This is the ultimate tool for debugging logic before coding.
Key Concepts:
Example: User Checkout Flow
@startuml
autonumber

actor User
participant Frontend
participant Backend
participant Database
participant Stripe

User -> Frontend : Clicks "Checkout"
Frontend -> Backend : POST /api/checkout
Backend -> Database : Validate inventory
Database --> Backend : Inventory OK
Backend -> Stripe : Create Payment Intent
Stripe --> Backend : Client Secret
Backend --> Frontend : Return Secret
Frontend -> User : Show Payment Form

@enduml
PlantUML Tip: Adding the autonumber keyword at the top automatically numbers each step (1, 2, 3...). This is a massive "no-bloat" trick for code reviews, as team members can simply say, "Let's look at step 4 in the sequence diagram."
Takeaway: This diagram prevents the classic "I thought the frontend was handling that" argument. It establishes a clear, chronological contract between services.
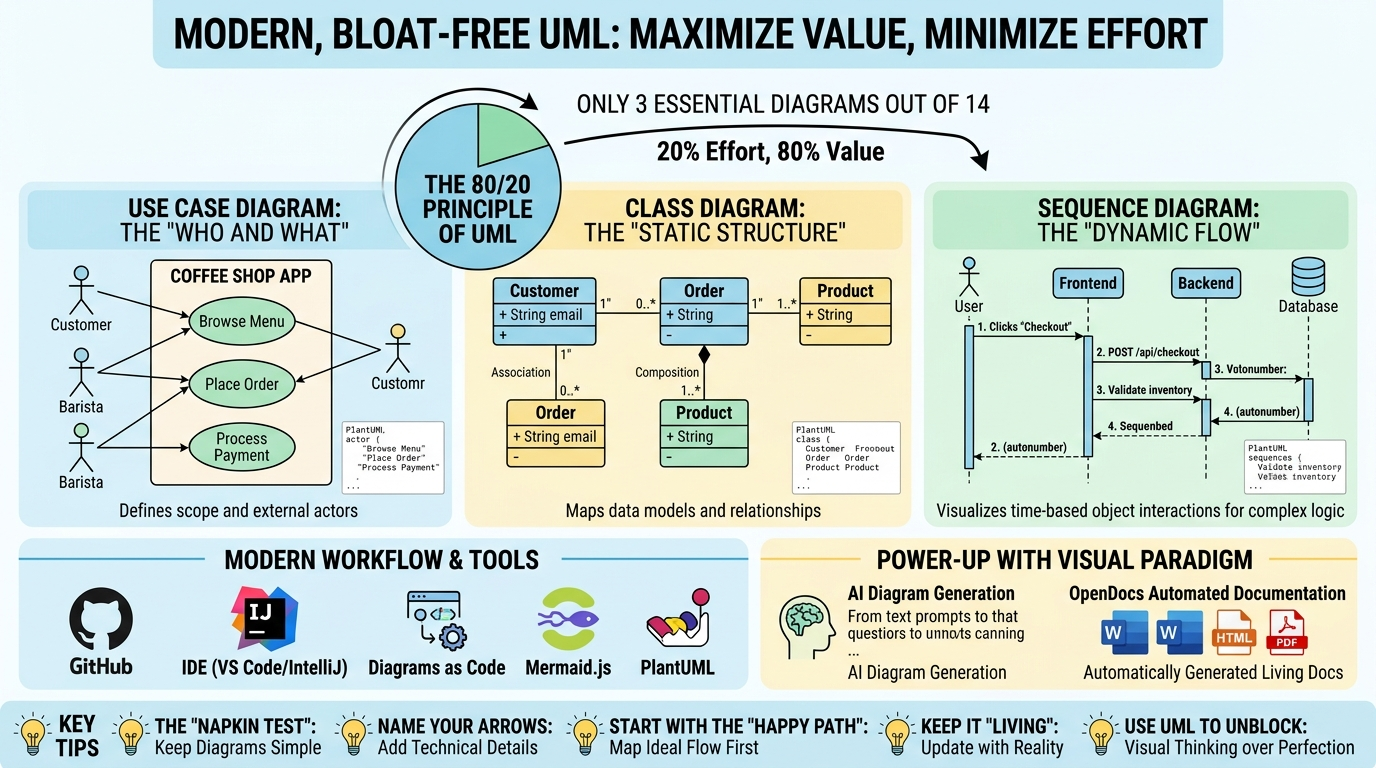
To keep UML "bloat-free," use tools that integrate into your modern workflow and automate the heavy lifting. Today’s ecosystem ranges from lightweight text-based renderers to AI-powered enterprise suites.
The Modern Workflow: Start your brainstorming in Mermaid or Excalidraw for speed. Once the architecture is finalized, use PlantUML to keep it in version control, or leverage Visual Paradigm’s AI to flesh out detailed enterprise models, relying on OpenDocs to automatically publish the specs to your team.
If your diagram is so complex it requires scrolling horizontally or vertically to understand, it’s too complex. Break it into two smaller diagrams. A good diagram should be understandable in 30 seconds.
Don’t just draw a line from Service A to Service B. Label the line with what is being sent (e.g., JSON payload, HTTP 404, User ID). This turns a vague drawing into a technical specification.
When drawing a Sequence or Use Case diagram, map out the ideal scenario first (everything works perfectly). Once the team agrees on that, add alt or opt (alternative/optional) blocks for error handling. Don’t let edge cases clutter the initial design.
A diagram is only valuable if it reflects reality. If you change the database schema, update the Class Diagram. If a tool makes this too hard, you’re using the wrong tool. This is why text-based diagrams in your codebase are a game-changer.
Don’t spend 3 hours making a diagram look pretty to prove you know UML. Spend 10 minutes making a messy diagram to unblock a teammate who is stuck on how two microservices should talk to each other.
UML isn’t about rigid rules; it’s about visual thinking.
Your homework: The next time you are about to build a new feature, API, or database table, open a Markdown file, write a quick PlantUML Sequence or Class diagram, and show it to a peer before you code. You’ll be amazed at how many bugs, edge cases, and miscommunications you prevent before they even happen.
Welcome to modern, bloat-free UML. Happy modeling!