Imagine trying to build a house without blueprints. You'd have contractors guessing where walls go, electricians running wires randomly, and plumbers installing pipes in impossible locations. Chaos, right?
Now imagine building complex software without a visual plan. That's exactly what happens when teams skip architectural modeling and dive straight into code. The result? The infamous "big ball of mud" architecture—tangled dependencies, unclear responsibilities, and systems that collapse under their own weight.
Enter UML (Unified Modeling Language)—the universal visual language that transforms software chaos into clarity. Whether you're a junior developer drowning in legacy code, a tech lead struggling to communicate architecture, or a stakeholder who needs to understand system behavior without reading thousands of lines of code, UML is your secret weapon.
This comprehensive beginner's guide will walk you through every essential UML diagram type, show you real-world examples, and teach you how to apply these powerful tools to create software systems that are clean, scalable, and maintainable. By the end, you'll have the confidence to choose the right diagram for any situation and start transforming your development process today.
Let's begin your journey from code chaos to architectural clarity.
Unified Modeling Language (UML) is a standardized visual modeling language that helps software teams:
UML turns ambiguous requirements, ad-hoc code structures, and siloed knowledge into clear, shareable blueprints that everyone—from business users to developers—can understand.
UML emerged in the mid-1990s from the unification of three leading object-oriented methods:
These "Three Amigos" joined forces, and the Object Management Group (OMG) adopted UML as a standard in 1997. The current major version, UML 2.5, expanded the language with better support for components, interactions, and executable models.
In chaotic projects where teams struggle with:
UML provides:
UML 2.5 defines 14 diagram types, divided into two main categories:

Show the organization of system elements—what the system IS
Model interactions and changes over time—how the system BEHAVES
Let's explore each type in detail.
What It Is:
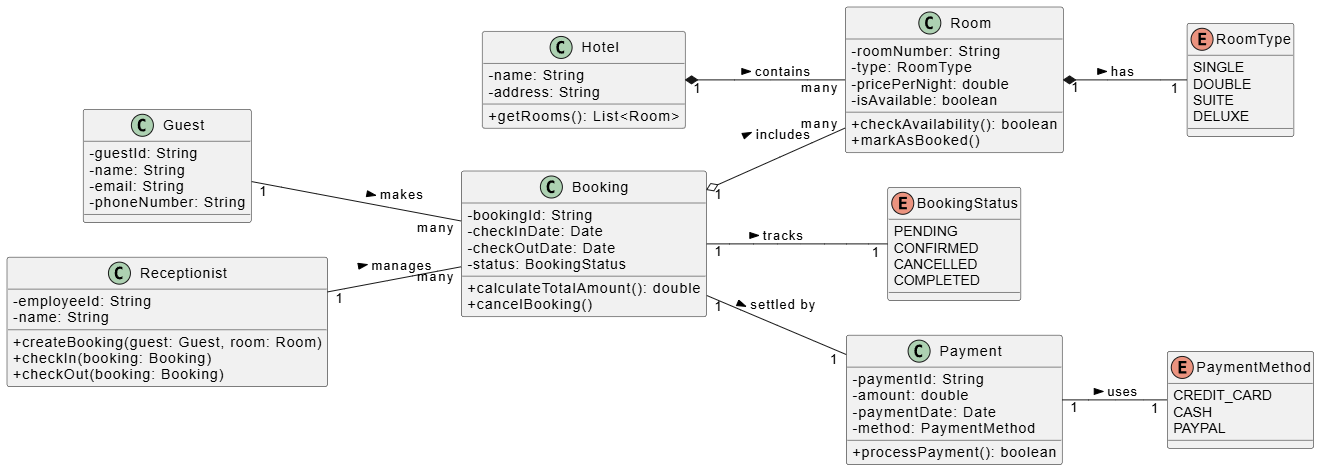
Class diagrams are the most fundamental UML diagrams. They model classes, attributes, operations (methods), and relationships between objects.
When to Use:
Key Elements:
Example: Online Banking System
Here's a text-based representation:
PlantUML Code:
@startuml
class Customer {
-id: String
-name: String
}

class Account {
-accountNumber: String
-balance: double
+deposit()
+withdraw()
}

class Transaction {
-amount: double
-date: Date
}

Customer "1" -- "*" Account
Account "1..*" -- "*" Transaction
@endumlRelationships Explained:
Visual Examples:
@startuml
skinparam classAttributeIconSize 0
left to right direction

class Hotel {
- name: String
- address: String
+ getRooms(): List<Room>
}

class Room {
- roomNumber: String
- type: RoomType
- pricePerNight: double
- isAvailable: boolean
+ checkAvailability(): boolean
+ markAsBooked()
}

enum RoomType {
SINGLE
DOUBLE
SUITE
DELUXE
}

class Guest {
- guestId: String
- name: String
- email: String
- phoneNumber: String
}

class Booking {
- bookingId: String
- checkInDate: Date
- checkOutDate: Date
- status: BookingStatus
+ calculateTotalAmount(): double
+ cancelBooking()
}

enum BookingStatus {
PENDING
CONFIRMED
CANCELLED
COMPLETED
}

class Payment {
- paymentId: String
- amount: double
- paymentDate: Date
- method: PaymentMethod
+ processPayment(): boolean
}

enum PaymentMethod {
CREDIT_CARD
CASH
PAYPAL
}

class Receptionist {
- employeeId: String
- name: String
+ createBooking(guest: Guest, room: Room)
+ checkIn(booking: Booking)
+ checkOut(booking: Booking)
}

Hotel "1" *-- "many" Room : contains >
Room "1" *-- "1" RoomType : has >
Guest "1" -- "many" Booking : makes >
Booking "1" o-- "many" Room : includes >
Booking "1" -- "1" BookingStatus : tracks >
Booking "1" -- "1" Payment : settled by >
Payment "1" -- "1" PaymentMethod : uses >
Receptionist "1" -- "many" Booking : manages >

@endumlBest Practices:
What It Is:
Object diagrams show instances of classes at a specific moment—like a photograph of your system's runtime state.
When to Use:
Key Difference from Class Diagrams:
Example:
If your Class Diagram shows Customer and Account classes, an Object Diagram might show:
customer1: Customer with name "John Smith"account1: Account with number "12345" and balance $5,000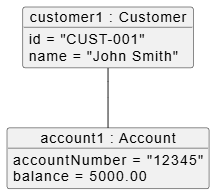
PlantUML Code:
@startuml
object "customer1 : Customer" as customer1 {
id = "CUST-001"
name = "John Smith"
}

object "account1 : Account" as account1 {
accountNumber = "12345"
balance = 5000.00
}

customer1 -- account1
@endumlWhat It Is:
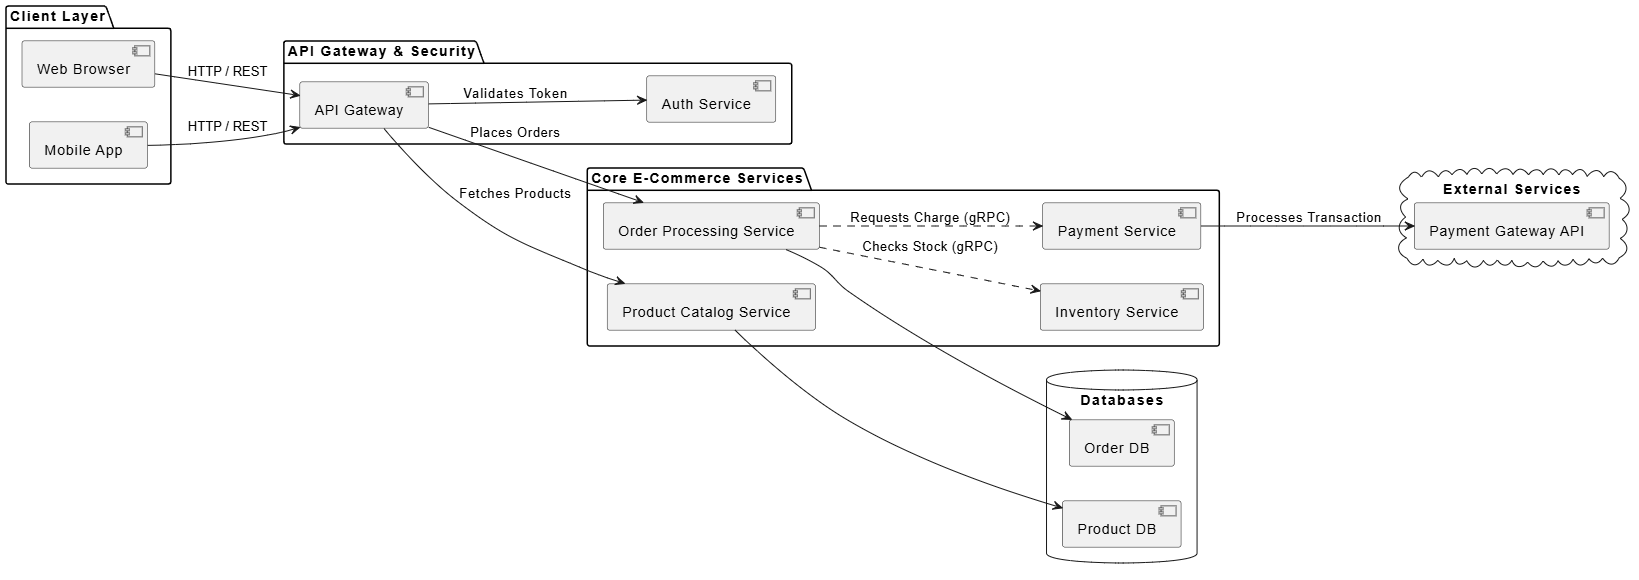
Component diagrams show high-level software components and their interfaces/dependencies. Think of them as architectural blueprints for modular systems.
When to Use:
Visual Examples: E-commerce System
@startuml
skinparam componentStyle uml2
left to right direction

package "Client Layer" {
[Web Browser] as Browser
[Mobile App] as Mobile
}

package "API Gateway & Security" {
[API Gateway] as Gateway
[Auth Service] as Auth
}

package "Core E-Commerce Services" {
[Product Catalog Service] as Catalog
[Order Processing Service] as Order
[Inventory Service] as Inventory
[Payment Service] as Payment
}

database "Databases" {
[Product DB] as ProdDB
[Order DB] as OrderDB
}

cloud "External Services" {
[Payment Gateway API] as BankAPI
}

' Client to API Gateway connections
Browser --> Gateway : HTTP / REST
Mobile --> Gateway : HTTP / REST

' Gateway to Services
Gateway --> Auth : Validates Token
Gateway --> Catalog : Fetches Products
Gateway --> Order : Places Orders

' Inter-service communication
Order ..> Inventory : Checks Stock (gRPC)
Order ..> Payment : Requests Charge (gRPC)

' Service to Database connections
Catalog --> ProdDB
Order --> OrderDB

' External integration
Payment --> BankAPI : Processes Transaction

@endumlBenefits:
What It Is:
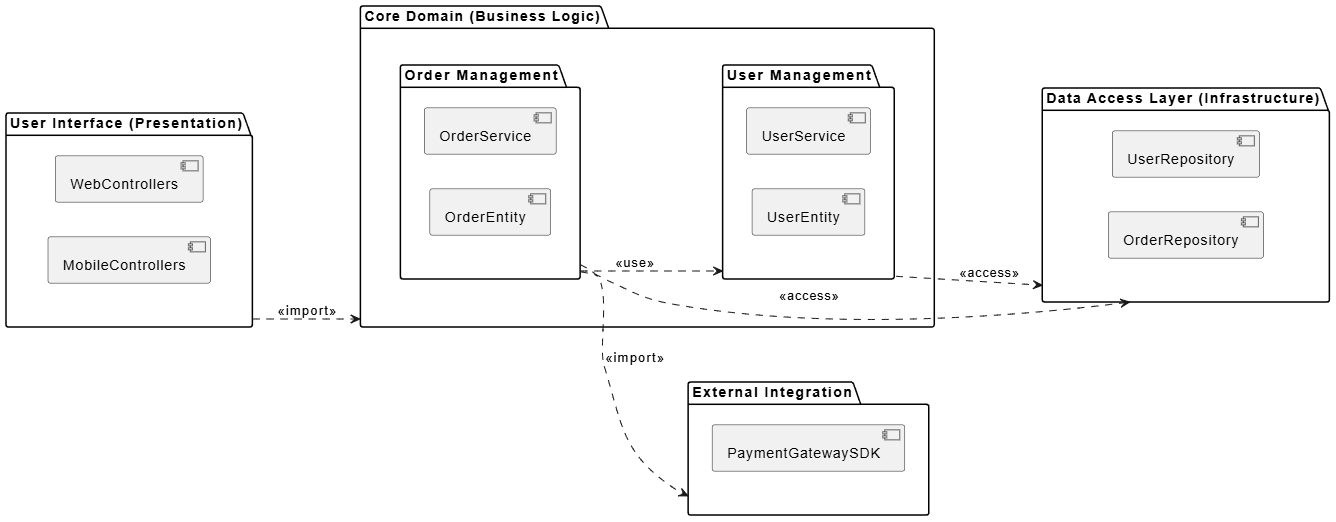
Package diagrams organize elements into namespaces (packages) to manage complexity and dependencies.
When to Use:
Example Structure:
PlantUML Code:
@startuml
left to right direction

package "User Interface (Presentation)" as UI {
[WebControllers]
[MobileControllers]
}

package "Core Domain (Business Logic)" as Domain {
package "User Management" as UserPkg {
[UserService]
[UserEntity]
}

package "Order Management" as OrderPkg {
[OrderService]
[OrderEntity]
}
}

package "Data Access Layer (Infrastructure)" as DataAccess {
[UserRepository]
[OrderRepository]
}

package "External Integration" as External {
[PaymentGatewaySDK]
}

' Dependency relationships showcasing import and access principles
UI ..> Domain : <<import>>
OrderPkg ..> UserPkg : <<use>>

UserPkg ..> DataAccess : <<access>>
OrderPkg ..> DataAccess : <<access>>
OrderPkg ..> External : <<import>>

@enduml
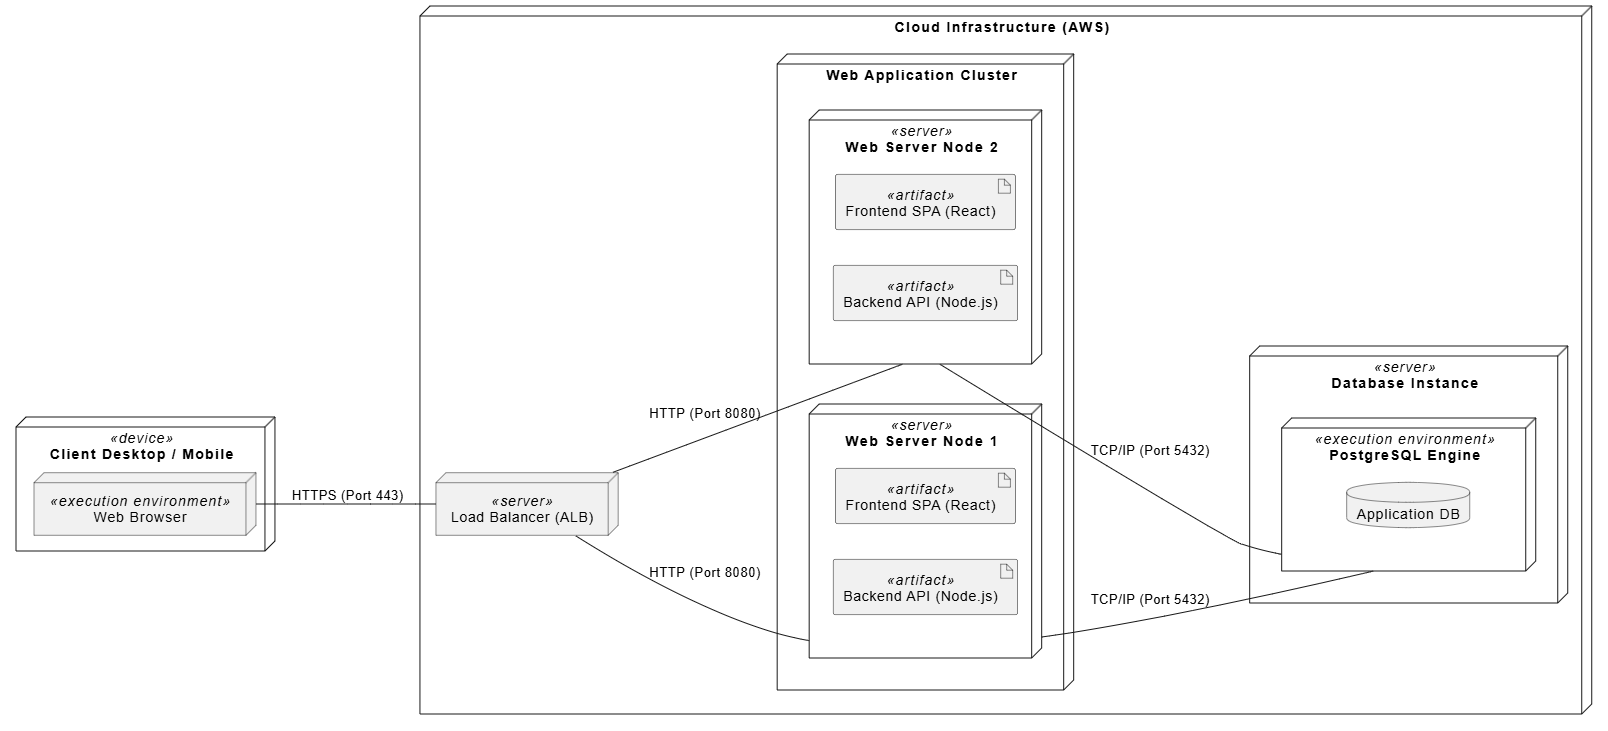
What It Is:
Deployment diagrams map software artifacts to hardware nodes (servers, devices) and show communication paths.
When to Use:
Visual Examples: Web Application Deployment
@startuml
!option handwritten true
left to right direction

node "Client Desktop / Mobile" as ClientDevice <<device>> {
node "Web Browser" as Browser <<execution environment>>
}

node "Cloud Infrastructure (AWS)" {

node "Load Balancer (ALB)" as ALB <<server>>

node "Web Application Cluster" {
node "Web Server Node 1" as WebNode1 <<server>> {
artifact "Frontend SPA (React)" as ArtifactFE1 <<artifact>>
artifact "Backend API (Node.js)" as ArtifactBE1 <<artifact>>
}
node "Web Server Node 2" as WebNode2 <<server>> {
artifact "Frontend SPA (React)" as ArtifactFE2 <<artifact>>
artifact "Backend API (Node.js)" as ArtifactBE2 <<artifact>>
}
}

node "Database Instance" as DBServer <<server>> {
node "PostgreSQL Engine" as DBEngine <<execution environment>> {
database "Application DB" as ApplicationDB
}
}
}

' Communication Paths
Browser -- ALB : HTTPS (Port 443)
ALB -- WebNode1 : HTTP (Port 8080)
ALB -- WebNode2 : HTTP (Port 8080)

WebNode1 -- DBEngine : TCP/IP (Port 5432)
WebNode2 -- DBEngine : TCP/IP (Port 5432)

@endumlCritical for:
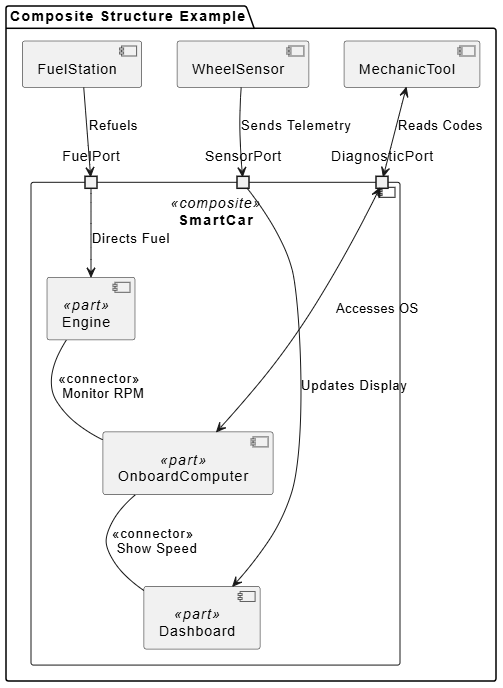
What It Is:
Details the internal structure of a class or component and shows how parts collaborate.
When to Use:
PlantUML Code:
@startuml
skinparam componentStyle uml2

package "Composite Structure Example" {

component "SmartCar" as Car <<composite>> {
' Internal Parts
component "Engine" as Eng <<part>>
component "Dashboard" as Dash <<part>>
component "OnboardComputer" as Comp <<part>>

' Ports
port "FuelPort" as FuelP
port "DiagnosticPort" as DiagP
port "SensorPort" as SensorP
}

component "FuelStation" as Station
component "MechanicTool" as Tool
component "WheelSensor" as Sensor
}

' External wiring to Ports
Station --> FuelP : Refuels
Tool <--> DiagP : Reads Codes
Sensor --> SensorP : Sends Telemetry

' Internal wiring from Ports to Parts
FuelP --> Eng : Directs Fuel
DiagP <--> Comp : Accesses OS
SensorP --> Dash : Updates Display

' Internal Part-to-Part Connections (Connectors)
Eng -- Comp : <<connector>> \n Monitor RPM
Comp -- Dash : <<connector>> \n Show Speed
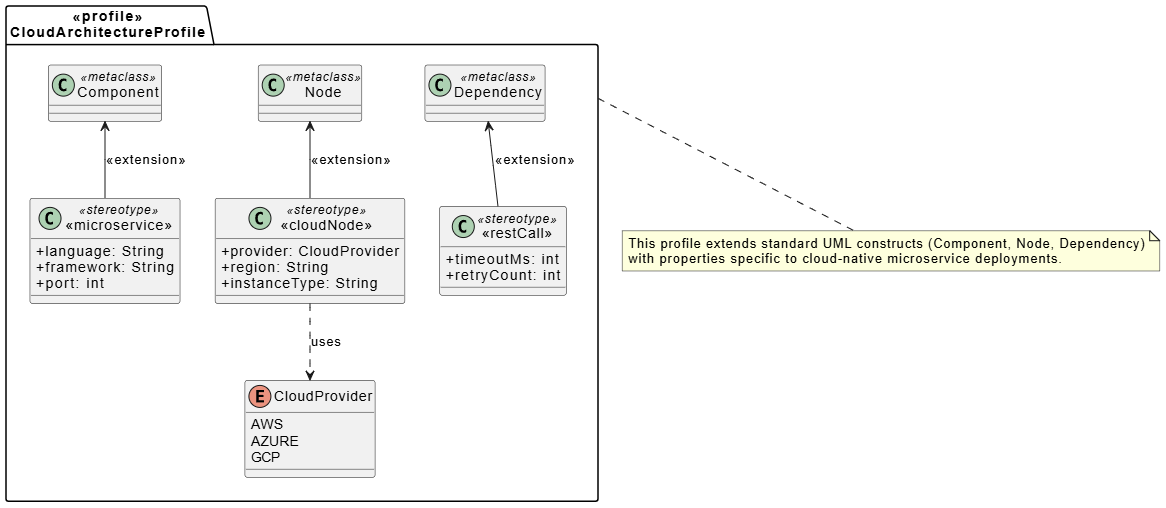
@endumlWhat It Is:
Extends UML for domain-specific needs using stereotypes, tagged values, and constraints.
When to Use:
@startuml
skinparam classAttributeIconSize 0

package "<<profile>>\nCloudArchitectureProfile" as CloudProfile {

' Metaclasses (Cleaned up syntax to prevent syntax compiler errors)
class Component <<metaclass>>
class Node <<metaclass>>
class Dependency <<metaclass>>

' Stereotypes (The custom extensions)
class "«microservice»" as Microservice <<stereotype>> {
+ language: String
+ framework: String
+ port: int
}

class "«cloudNode»" as CloudNode <<stereotype>> {
+ provider: CloudProvider
+ region: String
+ instanceType: String
}

class "«restCall»" as RestCall <<stereotype>> {
+ timeoutMs: int
+ retryCount: int
}

' Enumeration used by the stereotype properties
enum CloudProvider {
AWS
AZURE
GCP
}

' Extension Relationships
Microservice -up-> Component : <<extension>>
CloudNode -up-> Node : <<extension>>
RestCall -up-> Dependency : <<extension>>

' Stereotype associations
CloudNode .down.> CloudProvider : uses
}

note bottom of CloudProfile
This profile extends standard UML constructs (Component, Node, Dependency)
with properties specific to cloud-native microservice deployments.
end note
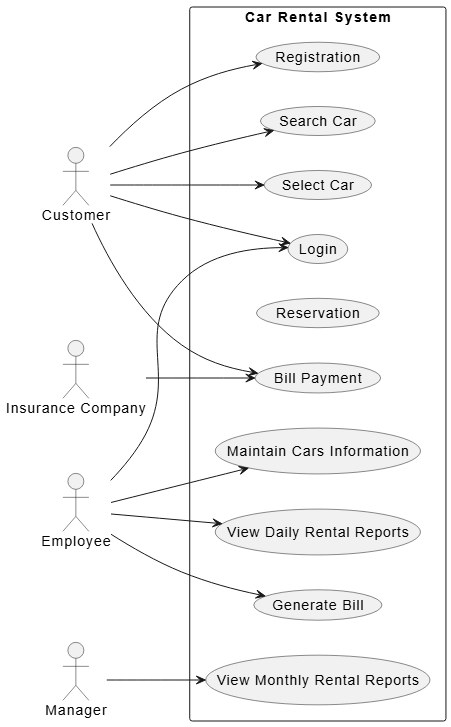
@endumlWhat It Is:
Use Case diagrams capture functional requirements from the user's perspective, showing actors (users) and use cases (system functions).
When to Use:
Key Elements:
Example: Library System
Visual Examples:
PlantUML Code
@startuml
left to right direction
skinparam packageStyle rectangle

actor Customer
actor Employee
actor Manager
actor "Insurance Company" as Insurance

rectangle "Car Rental System" {
  usecase "Login" as UC1
  usecase "Registration" as UC2
  usecase "Search Car" as UC3
  usecase "Select Car" as UC4
  usecase "Reservation" as UC5
  usecase "Maintain Cars Information" as UC6
  usecase "View Daily Rental Reports" as UC7
  usecase "View Monthly Rental Reports" as UC8
  usecase "Generate Bill" as UC9
  usecase "Bill Payment" as UC10

  ' Customer associations
  Customer --> UC1
  Customer --> UC2
  Customer --> UC3
  Customer --> UC4
  Customer --> UC10

  ' Employee associations
  Employee --> UC1
  Employee --> UC6
  Employee --> UC7
  Employee --> UC9

  ' Manager associations (if Manager is separate from Employee)
  Manager --> UC8

  ' Insurance Company association
  Insurance --> UC10
}

@enduml
Benefits:
What It Is:
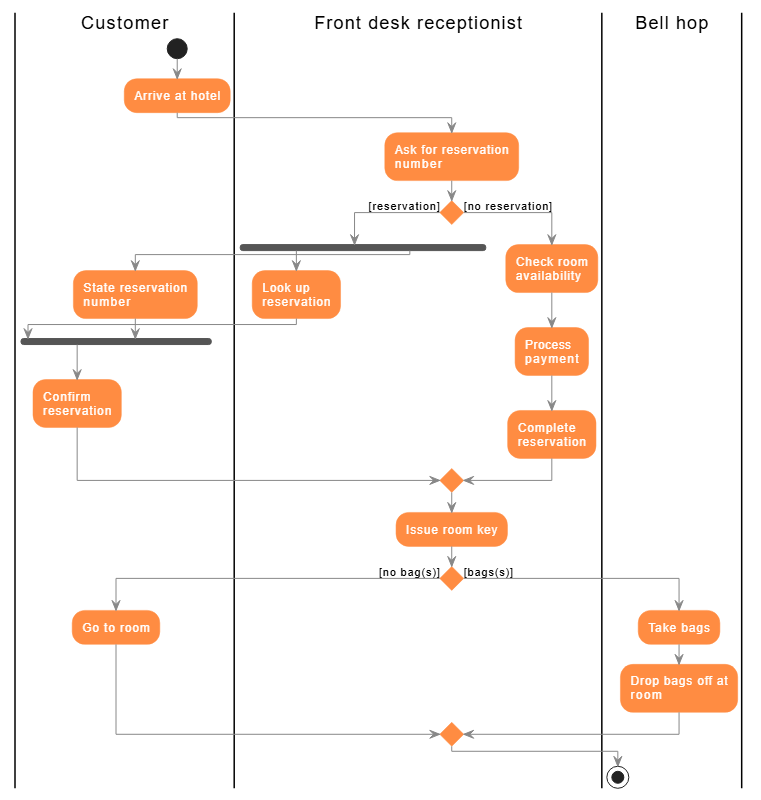
Activity diagrams model workflows, business processes, or algorithm flows—like sophisticated flowcharts with decisions, forks, and joins.
When to Use:
Key Elements:
Example: Order Processing
Start → Validate Order → [Stock Available?]
                        ├─ Yes → Reserve Stock → Process Payment → Ship → End
                        └─ No → Notify Customer → End
Visual Examples:
@startuml
skinparam ActivityBackgroundColor #FF8C42
skinparam ActivityBorderColor #FF8C42
skinparam ActivityFontColor white
skinparam ArrowColor #888888
skinparam ConditionEndStyle diamond

|Customer|
|Front desk receptionist|
|Bell hop|

|Customer|
start
:Arrive at hotel;

|Front desk receptionist|
:Ask for reservation\nnumber;

if () then ([reservation])
    fork
        :Look up\nreservation;
    fork again

        |Customer|
        :State reservation\nnumber;
    end fork

    |Customer|
    :Confirm\nreservation;
else ([no reservation])

    |Front desk receptionist|
    :Check room\navailability;
    :Process\npayment;
    :Complete\nreservation;
endif

:Issue room key;

if () then ([no bag(s)])

    |Customer|
    :Go to room;
else ([bags(s)])

    |Bell hop|
    :Take bags;
    :Drop bags off at\nroom;
endif

stop
@enduml
Real-World Application:
What It Is:
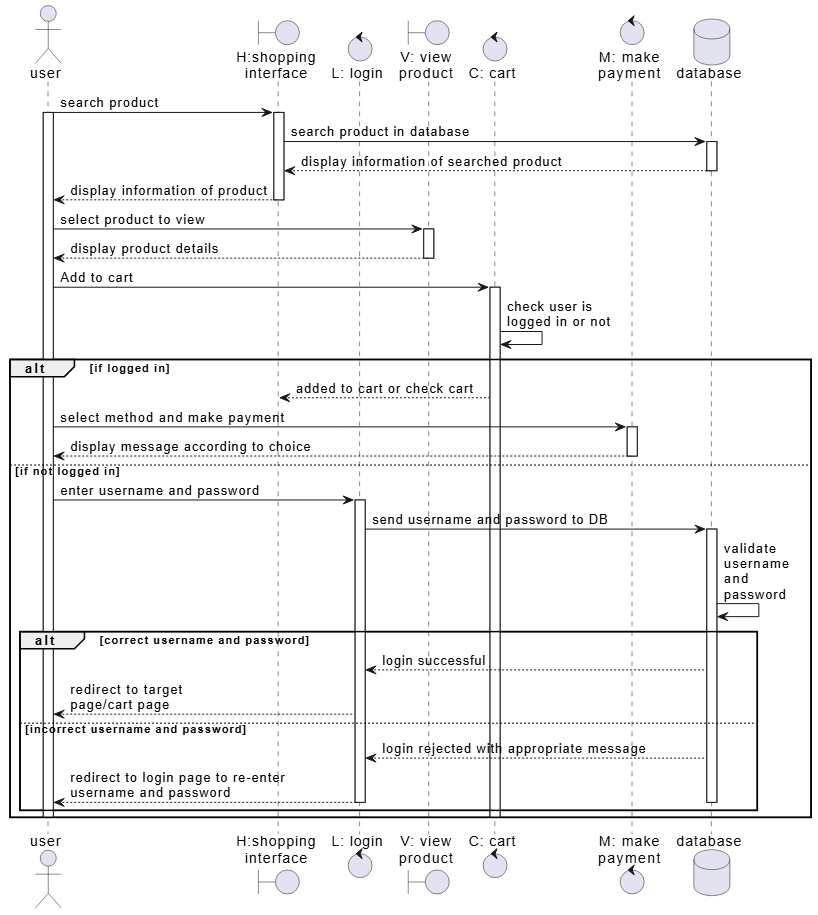
Sequence diagrams focus on time-ordered interactions between objects, showing lifelines, messages, and activations.
When to Use:
Key Elements:
Example: User Login Flow
Actor        UI          AuthService      Database
  │          │                │               │
  │──enterCredentials()──▶    │               │
  │          │                │               │
  │          │──validate()──▶ │               │
  │          │                │──queryUser()──▶
  │          │                │               │
  │          │                │◀──userData────│
  │          │◀──success───── │               │
  │◀──loginComplete───────────│               │
  │          │                │               │
Visual Examples:
@startuml
actor "user" as User
boundary "H:shopping\ninterface" as UI
control "L: login" as Login
boundary "V: view\nproduct" as View
control "C: cart" as Cart
control "M: make\npayment" as Payment
database "database" as DB

User -> UI : search product
activate User
activate UI
UI -> DB : search product in database
activate DB
DB --> UI : display information of searched product
deactivate DB
UI --> User : display information of product
deactivate UI

User -> View : select product to view
activate View
View --> User : display product details
deactivate View

User -> Cart : Add to cart
activate Cart
Cart -> Cart : check user is\nlogged in or not

alt if logged in
    Cart --> UI : added to cart or check cart
    User -> Payment : select method and make payment
    activate Payment
    Payment --> User : display message according to choice
    deactivate Payment

else if not logged in
    User -> Login : enter username and password
    activate Login
    Login -> DB : send username and password to DB
    activate DB
    DB -> DB : validate\nusername\nand\npassword

    alt correct username and password
        DB --> Login : login successful
        Login --> User : redirect to target\npage/cart page

    else incorrect username and password
        DB --> Login : login rejected with appropriate message
        Login --> User : redirect to login page to re-enter\nusername and password
        deactivate Login
        deactivate DB
    end
    deactivate Cart
    deactivate User
end

@enduml
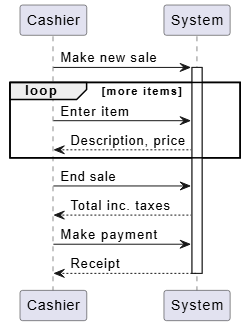
@startuml
participant "Cashier" as Cashier
participant "System" as System

Cashier -> System : Make new sale
activate System

loop more items
    Cashier -> System : Enter item
    System --> Cashier : Description, price
end

Cashier -> System : End sale
System --> Cashier : Total inc. taxes

Cashier -> System : Make payment
System --> Cashier : Receipt
deactivate System

@enduml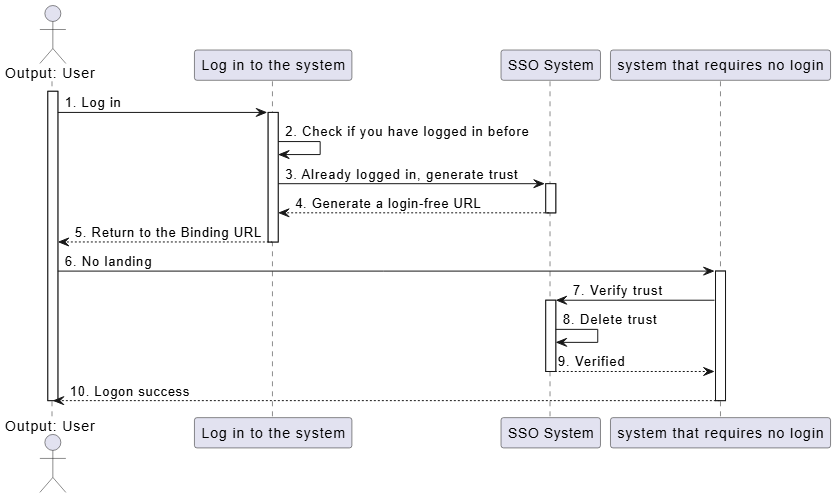
@startuml
actor "Output: User" as User
participant "Log in to the system" as LoginSystem
participant "SSO System" as SSOSystem
participant "system that requires no login" as NoLoginSystem

activate User
User -> LoginSystem : 1. Log in
activate LoginSystem

LoginSystem -> LoginSystem : 2. Check if you have logged in before

LoginSystem -> SSOSystem : 3. Already logged in, generate trust
activate SSOSystem

SSOSystem --> LoginSystem : 4. Generate a login-free URL
deactivate SSOSystem

LoginSystem --> User : 5. Return to the Binding URL
deactivate LoginSystem

User -> NoLoginSystem : 6. No landing
activate NoLoginSystem

NoLoginSystem -> SSOSystem : 7. Verify trust
activate SSOSystem

SSOSystem -> SSOSystem : 8. Delete trust

SSOSystem --> NoLoginSystem : 9. Verified
deactivate SSOSystem

NoLoginSystem --> User : 10. Logon success
deactivate NoLoginSystem
deactivate User

@endumlExcellent for:
What It Is:
Formerly called Collaboration diagrams, these emphasize the structural organization of interactions rather than time sequence.
When to Use:
Difference from Sequence Diagrams:
What It Is:
State Machine diagrams (Statecharts) show states an object goes through and transitions triggered by events.
When to Use:
Key Elements:
Example: Order Lifecycle
Order States: Pending → Paid → Shipped → Delivered
                      ↓
                  Cancelled (if refund requested)
Visual Examples:
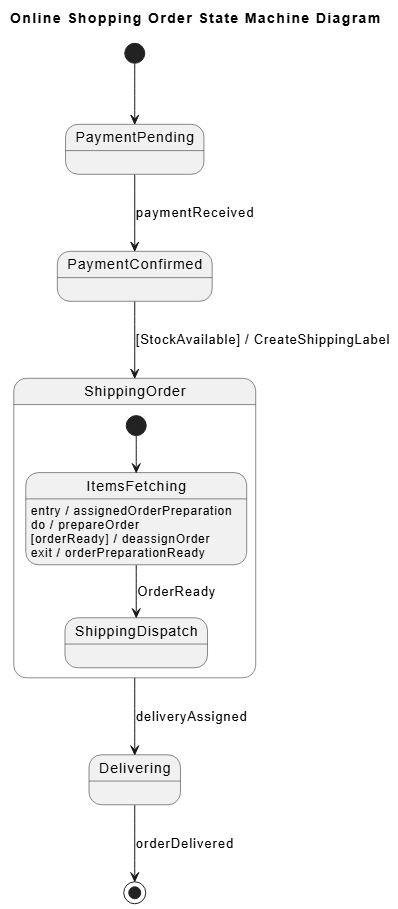
@startuml
title Online Shopping Order State Machine Diagram

[*] --> PaymentPending

state PaymentPending
state PaymentConfirmed
state Delivering

PaymentPending --> PaymentConfirmed : paymentReceived

PaymentConfirmed --> ShippingOrder : [StockAvailable] / CreateShippingLabel

state ShippingOrder {
    [*] --> ItemsFetching

    state ItemsFetching : entry / assignedOrderPreparation
    state ItemsFetching : do / prepareOrder
    state ItemsFetching : [orderReady] / deassignOrder
    state ItemsFetching : exit / orderPreparationReady

    ItemsFetching --> ShippingDispatch : OrderReady
    state ShippingDispatch
}

ShippingOrder --> Delivering : deliveryAssigned

Delivering --> [*] : orderDelivered

@enduml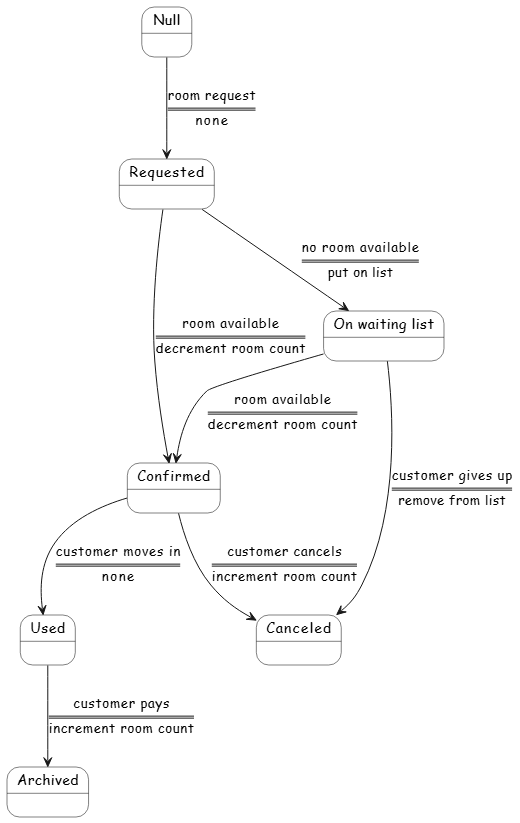
@startuml
skinparam StateBackgroundColor white
skinparam StateBorderColor black
skinparam StateFontName "Comic Sans MS"
skinparam ArrowFontName "Comic Sans MS"

state "Null" as Null
state "Requested" as Requested
state "Confirmed" as Confirmed
state "On waiting list" as OnWaitingList
state "Used" as Used
state "Canceled" as Canceled
state "Archived" as Archived

Null --> Requested : room request\n====\nnone

Requested --> Confirmed : room available\n====\ndecrement room count

Requested --> OnWaitingList : no room available\n====\nput on list

OnWaitingList --> Confirmed : room available\n====\ndecrement room count

OnWaitingList --> Canceled : customer gives up\n====\nremove from list

Confirmed --> Used : customer moves in\n====\nnone

Confirmed --> Canceled : customer cancels\n====\nincrement room count

Used --> Archived : customer pays\n====\nincrement room count

@enduml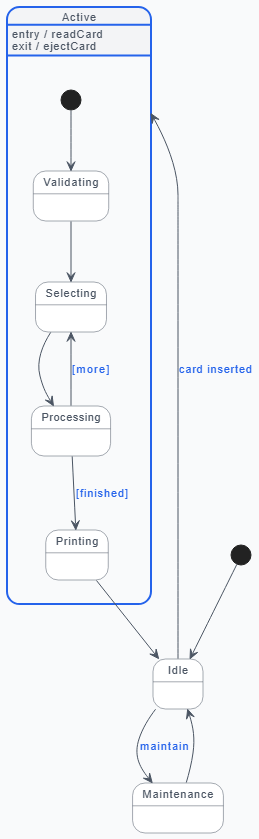
@startuml
' --- Visual Styling Configuration ---
skinparam backgroundColor #F9FAFB
skinparam state {
    BackgroundColor #FFFFFF
    BorderColor #4B5563
    FontColor #1F2937
    FontName "Helvetica Neue", Arial, sans-serif
    FontSize 13
    AttributeFontColor #4B5563
    AttributeFontSize 11
}
skinparam state<> {
    BackgroundColor #F3F4F6
    BorderColor #2563EB
    BorderThickness 2
}
skinparam arrow {
    Color #4B5563
    FontColor #2563EB
    FontName "Helvetica Neue", Arial, sans-serif
    FontSize 11
}

' --- State Definitions ---
[*] --> Idle

state "Idle" as Idle
state "Maintenance" as Maintenance

state "Active" as Active <> {
    [*] --> Validating

    state "Validating" as Validating
    state "Selecting" as Selecting
    state "Processing" as Processing
    state "Printing" as Printing

    Validating --> Selecting
    Selecting --> Processing
    Processing --> Selecting : [more]
    Processing --> Printing : [finished]

    Active : entry / readCard
    Active : exit / ejectCard
}

' --- Global Transitions ---
Idle --> Maintenance : maintain
Maintenance --> Idle

Idle --> Active : card inserted
Printing --> Idle

@endumlReal-World Applications:
What It Is:
Combines activity and sequence diagram elements for a high-level view of complex interactions.
When to Use:
What It Is:
Focuses on timing constraints and deadlines, showing state changes over specific time periods.
When to Use:
Follow this proven workflow to integrate UML into your development process:
Diagrams: Use Case + Activity Diagrams
Start by capturing "what" the system should do:
Example: For an e-commerce platform:
Diagrams: Package + Component + Deployment Diagrams
Design the system structure:
Example:
┌─────────────────────────────────────┐
│     Presentation Tier               │
│  (Web App, Mobile App, API Gateway) │
└──────────────────┬──────────────────┘
                   │
┌──────────────────┼──────────────────┐
│   Application Tier                   │
│  (User Service, Order Service,       │
│   Payment Service, Notification)     │
└──────────────────┬──────────────────┘
                   │
┌──────────────────┼──────────────────┐
│     Data Tier                        │
│  (PostgreSQL, Redis, MongoDB)        │
└──────────────────────────────────────┘
Diagrams: Class + Sequence + Communication Diagrams
Drill down into specifics:
Example: Class Diagram for E-commerce
+-------------+       +-------------+       +-------------+
|  Customer   |       |    Order    |       |   Product   |
+-------------+       +-------------+       +-------------+
| -id: UUID   |1    *| -id: UUID   |*    1| -id: UUID   |
| -email      |──────▶| -date       |──────▶| -name       |
| -name       |       | -status     |       | -price      |
+-------------+       | -total      |       +-------------+
                      | +calculate()|
                      | +ship()     |
                      +-------------+
                            │
                            ▼
                      +-------------+
                      | OrderItem   |
                      +-------------+
                      | -quantity   |
                      | -unitPrice  |
                      +-------------+
Diagrams: State Machine + Activity Diagrams
Model complex behaviors:
Example: Order State Machine
[Created] → [Payment Pending] → [Paid] → [Processing]
                                              │
                                              ▼
[Cancelled] ← [Refunded] ← [Shipped] → [Delivered]
All Diagram Types
Iterate and validate:
Living Documentation
Keep models current:
The Challenge:
A legacy monolithic banking application suffered from:
The UML Solution:
Phase 1: Understanding the Current State
Findings:
Phase 2: Designing the Future State
Target Architecture:
┌─────────────────────────────────────────────┐
│            API Gateway (Kong)               │
└──┬──────────┬──────────┬──────────┬─────────┘
   │          │          │          │
   ▼          ▼          ▼          ▼
┌──────  ┌──────┐  ┌──────┐  ┌──────────┐
│Account│  │Transaction│ │Notification│ │ Payment │
│Service│  │  Service  │ │  Service   │ │ Service │
└───┬──┘  └───┬──┘  └───┬──┘  └────┬─────┘
    │          │          │           │
    └────────────────────┴───────────┘
                  │
         ┌────────┴────────
         │                 │
    ┌────▼────┐      ┌────▼────┐
    │PostgreSQL│      │  Redis  │
    └──────────┘      └─────────┘
Phase 3: Implementation
Results After 12 Months:
✅ Modularity: Independent deployment of services
✅ Scalability: Auto-scaling based on load
✅ Faster Onboarding: New devs productive in 2 weeks (was 3 months)
✅ Reduced Defects: 70% fewer production incidents
✅ Faster Delivery: Weekly releases (was quarterly)
✅ Team Morale: Developers understand the system
Key Takeaway:
UML didn't just document the transformation—it enabled it by providing a shared language for architects, developers, and stakeholders.
Rule of Thumb:
Store diagrams in repositories:
/docs
  /uml
    /class-diagrams
      domain-model.puml
      user-service.puml
    /sequence-diagrams
      login-flow.puml
      checkout-flow.puml
    /deployment
      production.puml
      staging.puml
Tools like PlantUML allow text-based diagrams that work beautifully with Git:
@startuml
class Customer {
  -id: UUID
  -email: String
  +placeOrder()
}

class Order {
  -id: UUID
  -total: Double
  +calculateTotal()
}

Customer "1" --> "*" Order
@endumlUML is powerful but not alone:
** Diagrams.net (draw.io)**
📝 PlantUML
Example:
@startuml
left to right direction
actor User
rectangle "System" {
  User --> (Login)
  (Login) --> (Dashboard)
  (Dashboard) --> (Logout)
}
@enduml
⭐ StarUML
🏆 Visual Paradigm
For Beginners:
For Teams and Enterprises:
Common Pitfalls:
When NOT to Use UML:
C4 Model
Informal Architecture Diagrams
Domain-Driven Design (DDD)
Event Storming
Regulated Industries:
Complex Systems:
Large Teams:
You've just completed a comprehensive journey through the world of UML—from understanding its history and purpose to mastering all 14 diagram types, learning best practices, and discovering modern tools. But knowledge alone doesn't transform architecture; action does.
Remember the banking system case study? That transformation from tangled monolith to clean microservices didn't happen by accident. It happened because someone decided to:
You can do the same.
Don't try to diagram everything tomorrow. Instead:
This Week:
This Month:
This Quarter:
Here's what happens when you consistently apply UML:
Month 1: "These diagrams help me think through the design."
Month 3: "My team communicates better with these visuals."
Month 6: "We're catching design flaws before coding."
Year 1: "Our architecture is cleaner and more scalable."
Year 2: "New team members are productive in days, not months."
In a world of:
Visual modeling isn't optional—it's essential.
UML gives you:
Remember: Master architects aren't born—they're built through practice.
Every complex system you've ever used—Amazon, Netflix, your banking app—was designed by people who started exactly where you are now: curious, motivated, and ready to learn.
The journey from chaos to clarity is visual—and UML lights the way.
Now go draw your first diagram. Your future self (and your team) will thank you.
| Situation | Best Diagram(s) | Why |
|---|---|---|
| Gathering requirements | Use Case, Activity | Captures user needs and workflows |
| Designing database | Class, Object | Models entities and relationships |
| Planning microservices | Component, Package | Shows boundaries and dependencies |
| Understanding API flow | Sequence, Communication | Visualizes call sequences |
| Modeling workflows | Activity, State Machine | Shows process steps and states |
| Cloud architecture | Deployment, Component | Maps software to infrastructure |
| Debugging complex flow | Sequence, State Machine | Traces execution path |
| Onboarding developers | Class, Component, Deployment | System overview |
| Stakeholder presentation | Use Case, Activity, Deployment | Non-technical friendly |
| Code refactoring | Class, Component, Sequence | Understands current structure |
Books:
Online Courses:
Communities:
Practice Platforms:
Happy Modeling! 🎨📐
Remember: The best diagram is the one that gets drawn, shared, and used.