UML is a standard language for specifying, visualizing, constructing, and documenting the artifacts of software systems. Object Management Group (OMG) created UML and UML 1.0 specification draft was proposed to the OMG in January 1997. UML can be described as a general-purpose visual modeling language to visualize, specify, construct and document software systems. Although UML is generally used to model software systems it is not limited within this boundary. It is also used to model non-software systems as well like process flow in a manufacturing unit etc. UML is not a programming language but tools can be used to generate code in various languages using UML diagrams.

A picture is worth a thousand words, this absolutely fits while discussing UML. Object-oriented concepts were introduced much earlier than UML. So at that time, there were no standard methodologies to organize and consolidate the object-oriented development. At that point in time UML came into the picture. There are a number of goals for developing UML but the most important is:
At the conclusion, the goal of UML can be defined as a simple modeling mechanism to model all possible practical systems in today’s complex environment.
Different users use any real-world system. The users can be developers, testers, business people, analysts and many more. So before designing a system the architecture is made with different perspectives in mind. The most important part is to visualize the system from different viewers’ perspective. The better we understand the better we make the system. This set of views is known as the 4+1 Views of Software Architecture. UML plays an important role in defining different perspectives of a system. These perspectives are:
+ 4 Architecture views
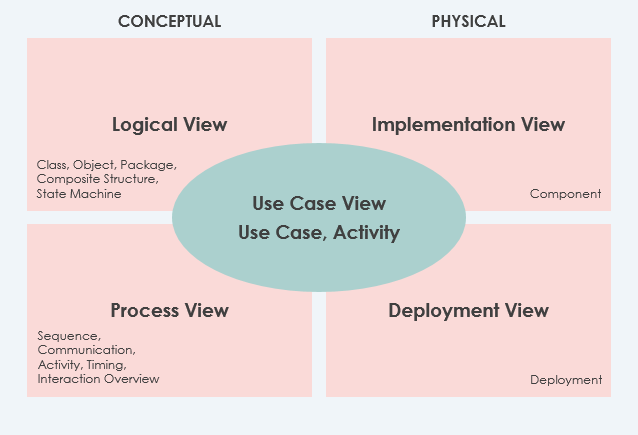
And the center is the Use Case view which connects all these four. A Use case represents the functionality of the system. So the other perspectives are connected with the use case.
In addition, you may wish to represent the following:
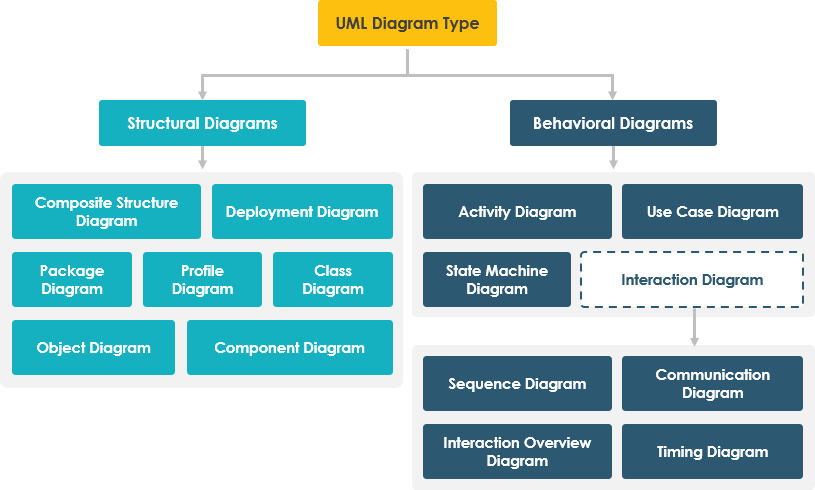
Diagrams are the heart of UML. These diagrams are broadly categorized as structural and behavioral diagrams.
Structure diagrams show the static structure of the system and its parts on different abstraction and implementation levels and how they are related to each other. The elements in a structure diagram represent the meaningful concepts of a system and may include abstract, real-world and implementation concepts, there are seven types of structure diagram as follows:
Behavior diagrams show the dynamic behavior of the objects in a system, which can be described as a series of changes to the system over time, there are seven types of behavior diagrams as follows:
Class diagrams are the most popular UML diagrams used by the object-oriented community. It describes the objects in a system and their relationships. A class diagram consists of attributes and functions.
A single class diagram describes a specific aspect of the system and the collection of class diagrams represents the whole system. Basically the class diagram represents the static view of a system.
Class diagrams are the only UML diagrams, which can be mapped directly with object-oriented languages. So it is widely used by the developer community.
The following Class Diagram example represents two classes - User and Attachment. A user can upload multiple attachments so the two classes are connected with an association, with 0..* as multiplicity on the Attachment side.

An object diagram is an instance of a class diagram. So the basic elements are similar to a class diagram. Object diagrams are consist of objects and links. It captures the instance of the system at a particular moment.
A static object diagram is an instance of a class diagram; it shows a snapshot of the detailed state of a system at a point in time. The difference is that a class diagram represents an abstract model consisting of classes and their relationships. However, an object diagram represents an instance at a particular moment, which is concrete in nature. The use of object diagrams is fairly limited, namely to show examples of data structure.
The following Object Diagram example shows you how the object instances of User and Attachment class "look like" at the moment Peter (i.e. the user) is trying to upload two attachments. So there are two Instance Specifications for the two attachment objects to be uploaded.

Component diagrams are a special kind of UML diagram to describe the static implementation view of a system. Component diagrams consist of physical components like libraries, files, folders, etc.
This diagram is used from an implementation perspective. More than one component diagrams are used to represent the entire system. Forward and reverse engineering techniques are used to make executables from component diagrams.

Component diagrams are used to describe the static deployment view of a system. System engineers mainly use these diagrams.
Deployment diagrams are consist of nodes and their relationships. An efficient deployment diagram is an integral part of software application development.

The package diagram is a UML structure diagram that shows packages and dependencies between the packages. Model diagrams allow showing different views of a system, for example, as multi-layered (aka multi-tiered) application - multi-layered application model.

Composite Structure Diagram is one of the new artifacts added to UML 2.0. A composite structure diagram is similar to a class diagram and is a kind of component diagram mainly used in modeling a system at a micro point-of-view, but it depicts individual parts instead of whole classes. It is a type of static structure diagram that shows the internal structure of a class and the collaborations that this structure makes possible.
This diagram can include internal parts, ports through which the parts interact with each other or through which instances of the class interact with the parts and with the outside world, and connectors between parts or ports. A composite structure is a set of interconnected elements that collaborate at runtime to achieve some purpose. Each element has some defined role in the collaboration.

A profile diagram enables you to create a domain and platform-specific stereotypes and define the relationships between them. You can create stereotypes by drawing stereotype shapes and relate them with composition or generalization through the resource-centric interface. You can also define and visualize the tagged values of stereotypes.

A use-case model describes a system's functional requirements in terms of use cases. It is a model of the system's intended functionality (use cases) and its environment (actors). Use cases enable you to relate what you need from a system to how the system delivers on those needs. It consists of use cases, actors and their relationships. The use case diagram is used at a high-level design to capture the requirements of a system. It represents the system's functionalities and its flow. Although the use case diagrams are not a good candidate for forward and reverse engineering but still they are used in a slightly different way to model it.
Because it is a very powerful planning instrument, the use-case model is generally used in all phases of the development cycle by all team members.

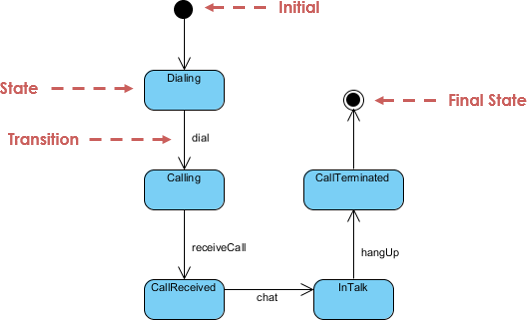
A State Machine diagram (also known as statechart, state diagram or state transition diagram), developed by David Harel, is one of the seven diagrams used for modeling the dynamic nature of a system.
These diagrams are used to model the entire life cycle of an object. The activity diagram is a special kind of Statechart diagram.
The state of an object is defined as the condition where an object resides for a particular time and the object again moves to other states when some events occur. Statechart diagrams are also used for forward and reverse engineering.
The activity diagram is another important diagram to describe dynamic behavior. The activity diagram consists of activities, links, relationships, etc. It models all types of flows like parallel, single, concurrent, etc. The activity diagram describes the flow control from one activity to another without any messages. These diagrams are used to model a high-level view of business requirements. In the Unified Modeling Language, activity diagrams are intended to model both computational and organizational processes (i.e. workflows).

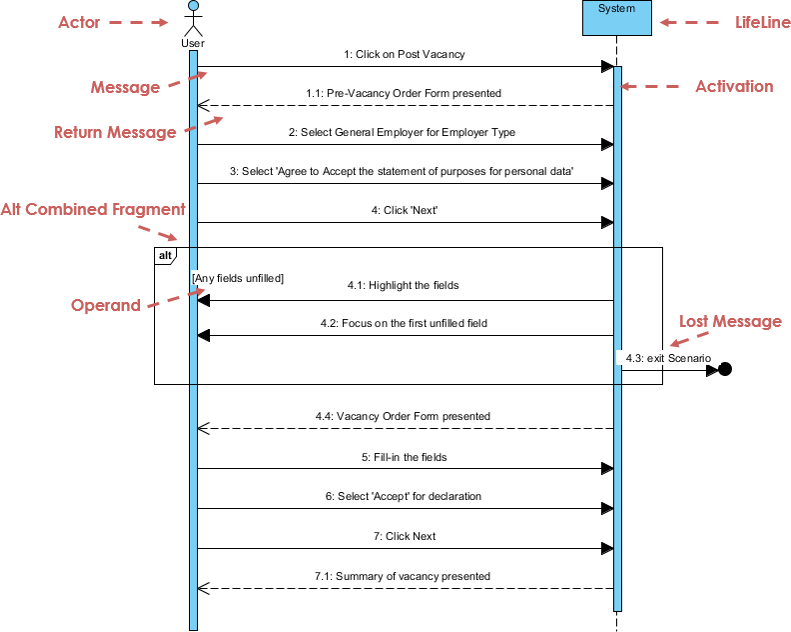
The Sequence Diagram models the collaboration of objects based on a time sequence. It shows how the objects interact with others in a particular scenario of a use case. With the advanced visual modeling capability, you can create a complex sequence diagram in a few clicks. Besides, some modeling tool such as Visual Paradigm can generate sequence diagram from the flow of events which you have defined in the use case description.
Similar to the Sequence Diagram, the Communication Diagram is also used to model the dynamic behavior of the use case. When compared to the Sequence Diagram, the Communication Diagram is more focused on showing the collaboration of objects rather than the time sequence. They are actually semantically equivalent, so some of the modeling tools such as Visual Paradigm allows you to generate it from one to the other.

The Interaction Overview Diagram focuses on the overview of the flow of control of the interactions. It is a variant of the Activity Diagram where the nodes are the interactions or interaction occurrences. The Interaction Overview Diagram describes the interactions where messages and lifelines are hidden. You can link up the "real" diagrams and achieve high degree navigability between diagrams inside the Interaction Overview Diagram.

Timing Diagram shows the behavior of the object(s) in a given period of time. A timing diagram is a special form of a sequence diagram. The differences between the timing diagram and sequence diagram are the axes are reversed so that the time is an increase from left to right and the lifelines are shown in separate compartments arranged vertically.

There are two aspects of "unified" that the UML achieves:
Applying UML principles in real-world software architecture can be challenging. Visual Paradigm’s AI-powered tools bridge the gap between abstract requirements and professional-grade diagrams, helping you visualize complex systems in a fraction of the time.
Instant diagram drafting through natural conversation. Perfect for quickly capturing use case views and system behaviors.
Step-by-step AI-guided workflows to create and evolve your architecture from simple sketches to detailed implementation views.
Generate professional UML diagrams directly within the Visual Paradigm Desktop, ensuring full compliance with OMG standards.
A modern knowledge management system to centralize your documents and embed live AI-generated diagrams.
Ready to modernize your modeling process?