The C4 Model is a lightweight, hierarchical approach to visualizing software architecture at four distinct levels of abstraction: Context, Containers, Components, and Code. Designed to help software development teams communicate architecture clearly and consistently, the C4 Model provides a shared vocabulary and visual notation that scales from high-level system overviews down to implementation details—without overwhelming stakeholders with unnecessary complexity.
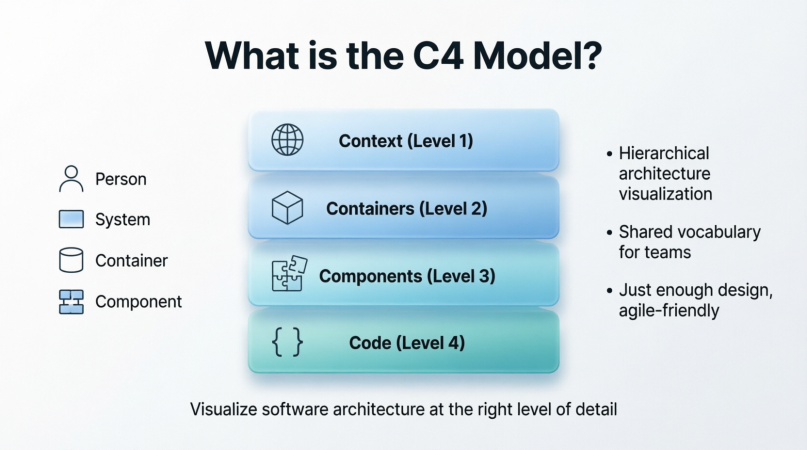
Unlike traditional modeling approaches that often demand exhaustive upfront documentation, the C4 Model embraces agility. It encourages teams to create "just enough" architecture diagrams to facilitate understanding, decision-making, and collaboration across technical and non-technical audiences.
The C4 Model was created by Simon Brown, a renowned software architect, consultant, and author of Software Architecture for Developers. Brown developed the model in response to a common industry problem: architecture diagrams were either too vague to be useful or so detailed they became unmaintainable. First introduced around 2011, the C4 Model has since gained widespread adoption in agile teams, enterprise architecture practices, and DevOps communities worldwide.
Before the C4 Model, teams often struggled with:
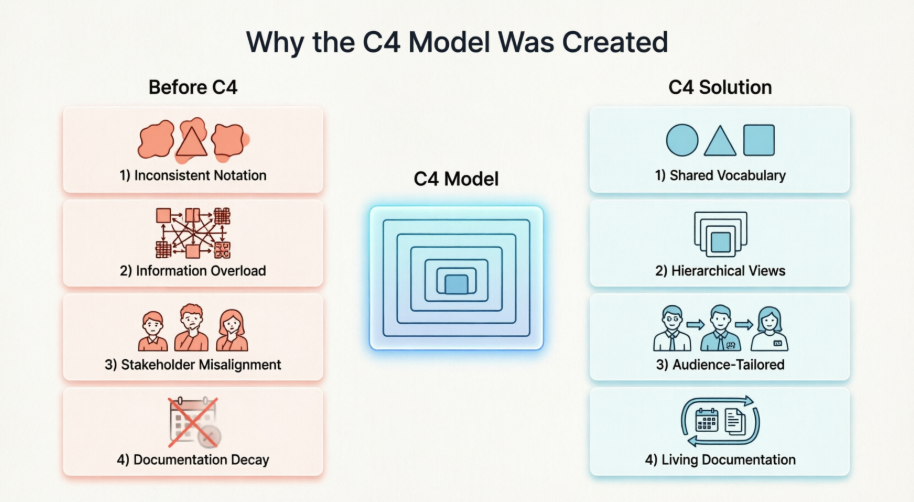
Inconsistent notation: Different teams used different symbols, making cross-team collaboration difficult.
Information overload: Diagrams tried to show everything at once, confusing rather than clarifying.
Stakeholder misalignment: Business stakeholders couldn't understand technical diagrams, while developers found high-level sketches too abstract.
Documentation decay: Architecture diagrams quickly became outdated as code evolved.
The C4 Model addresses these challenges by providing a structured yet flexible framework that adapts to a system's complexity and evolves alongside the codebase.
At its heart, the C4 Model embodies the agile principle of just enough, just in time. Rather than demanding comprehensive architecture documentation before coding begins, it encourages teams to:
Start with a high-level context diagram to align stakeholders.
Drill down into containers and components only as needed.
Keep diagrams living documents, updated iteratively alongside development.
Focus on communication value over artistic perfection.
This philosophy reduces waste, accelerates delivery, and ensures architecture remains a practical tool—not a bureaucratic artifact.
The C4 Model's power lies in its hierarchical structure. Each level answers different questions for different audiences, with clear boundaries between abstraction layers.
Audience: Everyone (technical and non-technical stakeholders)
Purpose: Show your software system in its environment—how it fits into the bigger picture.
A System Context Diagram depicts:
Your software system as a single box.
The people (users, roles) who interact with it.
The external systems it depends on or integrates with (e.g., payment gateways, legacy databases, third-party APIs).
High-level relationships and data flows between these elements.
Example: For an e-commerce platform, this diagram would show customers, admins, the shopping system, payment processors, inventory systems, and email services—without revealing internal implementation.
Audience: Technical stakeholders (developers, architects, ops teams)
Purpose: Reveal the high-level technology choices and how responsibilities are distributed.
A "container" in C4 terminology is a deployable unit—not a Docker container (though Docker containers can be C4 containers). Examples include:
A web application (React SPA)
A mobile app (iOS/Android)
A server-side application (Spring Boot service)
A database (PostgreSQL)
A file system or message queue
This diagram shows:
How containers interact via APIs, messaging, or shared storage.
The technology stack for each container (e.g., "Node.js + Express", "MongoDB").
Key responsibilities of each container.
Example: The e-commerce system might be broken into: Web Frontend (React), API Gateway (Node.js), Order Service (Java/Spring), Product Catalog (PostgreSQL), and Payment Service (external).
Audience: Developers and technical leads
Purpose: Zoom into a single container to show its internal modular structure.
A component is a grouping of related functionality encapsulated behind a well-defined interface. Components are not frameworks or libraries—they are logical units of implementation.
This diagram details:
Components within one container (e.g., OrderController, PaymentProcessor, InventoryValidator).
Interfaces and dependencies between components.
Technology choices at the code-module level (optional).
Example: Inside the Order Service container, you might see components like OrderCreationHandler, FraudDetectionService, and NotificationDispatcher, communicating via method calls or events.
Audience: Developers working on specific modules
Purpose: Map components to actual code structures (classes, functions, modules).
Level 4 is optional and often auto-generated. It might include:
UML class diagrams
Package dependency graphs
Sequence diagrams for critical workflows
Because code changes frequently, Level 4 diagrams are best generated from code (using tools like Visual Paradigm's AI-powered generators) rather than hand-drawn. Many teams skip manual Level 4 diagrams entirely, relying on IDE navigation and code search instead.
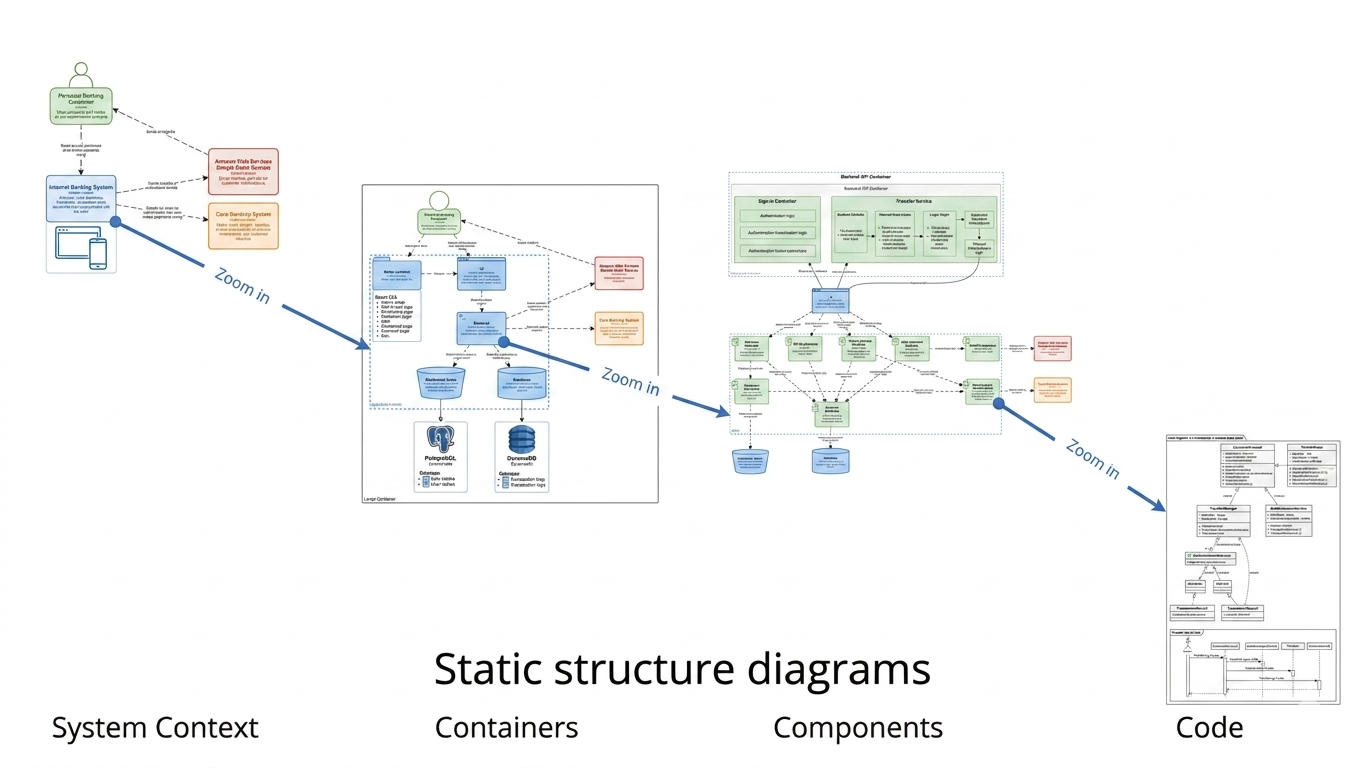
The C4 levels form a nested hierarchy:
One System Context Diagram (Level 1) contains multiple Containers (Level 2).
Each Container can be expanded into multiple Components (Level 3).
Each Component maps to Code structures (Level 4).
This structure enables progressive disclosure: stakeholders see only the detail relevant to them, while developers can drill down as needed. Navigation between levels should be intuitive—ideally supported by interactive tools that enable referenced diagrams and sub-diagram decomposition.
The C4 Model uses four primary element types:
Person: An individual role interacting with the system (e.g., "Customer", "Support Agent").
Software System: The highest-level boundary of your solution (Level 1).
Container: A deployable/application boundary (Level 2).
Component: A modular unit within a container (Level 3).
Each element has a name, description, and optional technology tags. Visual Paradigm provides a comprehensive symbol library for these core C4 elements, ensuring you can create clear and consistent diagrams that follow official notation standards .
Relationships are directional arrows labeled with:
Protocol (e.g., HTTPS, gRPC, AMQP)
Purpose (e.g., "submits order", "sends confirmation email")
Data (optional, e.g., "JSON: OrderDetails")
Keep labels concise and action-oriented. Avoid ambiguous terms like "uses" or "connects to".
C4 diagrams support tags to categorize elements (e.g., database, external, mobile). Tools like Visual Paradigm let you define styles:
Colors for element types (e.g., blue for internal systems, gray for external)
Shapes for containers vs. components
Line styles for sync vs. async communication
Metadata (e.g., owner, SLA, deployment environment) can be attached to elements for documentation purposes, and Visual Paradigm's inline editing allows you to modify text and properties directly on the diagram without separate dialog boxes for a faster workflow .
Static diagrams (the core of C4) show structure: what exists and how it connects.
Dynamic diagrams (optional supplements) show behavior: sequence diagrams or flowcharts illustrating key workflows (e.g., "Place Order" journey).
Visual Paradigm supports the C4 Dynamic Diagram type to show the dynamic behavior of the system, such as the sequence of interactions between components. Use dynamic diagrams sparingly to clarify complex interactions—not to replace static structure.
While not part of the core C4 hierarchy, deployment diagrams show how containers map to infrastructure:
Servers, VMs, Kubernetes pods, cloud regions
Network boundaries (VPCs, firewalls)
Environment distinctions (dev, staging, prod)
Visual Paradigm includes dedicated support for C4 Deployment Diagrams to illustrate how containers are mapped to infrastructure . These can be created as overlays on Level 2 diagrams or as separate views within the same project.
For teams seeking a professional, all-in-one solution for C4 modeling, Visual Paradigm stands out as the most comprehensive tool available today. It offers both a powerful desktop application (Visual Paradigm Desktop) and a collaborative cloud-based platform (Visual Paradigm Online), each purpose-built to support the complete C4 Model hierarchy.
✅ Full Native C4 Support: Visual Paradigm Desktop provides dedicated support for all six C4 diagram types: System Context, Container, Component, System Landscape, Dynamic, and Deployment . This ensures your diagrams automatically follow official C4 notation and best practices without manual formatting work.
✅ AI-Powered Diagram Generation: The AI C4 Diagram Generator transforms a simple system description into a complete, standards-compliant C4 suite in seconds. Simply type your project name and architecture overview, and the AI generates professional starting points for any of the six diagram levels—eliminating the "blank canvas" hurdle.
✅ Comprehensive Symbol Library: While the C4 model is notation-independent, Visual Paradigm provides a complete library of dedicated C4 shapes for Person, Software System, Container, and Component elements, ensuring visual consistency across your documentation.
✅ Hierarchical Navigation: Create sub-diagrams to decompose complex views into manageable layers. Use referenced diagrams to link between Context, Container, and Component views, enabling intuitive drill-down navigation even across large projects.
✅ Team Collaboration: Store projects in a centralized repository with built-in version control to track changes, compare revisions, and resolve conflicts. Visual Paradigm's cloud platform enables real-time collaboration with team members anywhere in the world.
✅ Professional Publishing: Export your C4 models into interactive HTML websites using Project Publisher, or generate comprehensive architecture reports in PDF, Word, or PowerPoint formats using Report Composer.
✅ Multi-Format Export & Integration: Share diagrams via PNG, JPG, SVG, GIF, or PDF. Embed visuals directly into Microsoft Office documents, or import existing Visio files to modernize legacy documentation .
Install or Access: Download Visual Paradigm Desktop or sign up for Visual Paradigm Online (no credit card required for free tier).
Create a New C4 Diagram: From the Diagram menu, select New → search "C4" → choose your diagram type (Context, Container, Component, Landscape, Dynamic, or Deployment) .
Build with Drag-and-Drop: Use the resource-centric interface to add People, Systems, Containers, and Components. Connect elements with labeled relationships using intuitive inline editing .
Leverage AI (Optional): For rapid prototyping, use the AI Diagram Generator: enter your system description, select target audience (e.g., "Executive" vs. "Engineering"), and generate a complete diagram suite instantly.
Navigate Hierarchically: Right-click any element to create or link to a lower-level diagram (e.g., click a Container to open its Component view).
Publish & Share: Use Project Publisher to generate a browsable HTML documentation site, or export reports for stakeholder reviews.
| Option | Best For | Key Advantages |
|---|---|---|
| Visual Paradigm Desktop | Enterprise teams, offline work, advanced modeling | Full C4 suite, AI generation, version control, report publishing, sub-diagram decomposition |
| Visual Paradigm Online | Remote teams, quick collaboration, lightweight projects | Browser-based, real-time co-editing, free tier available, Visio import, Office integration |
Pro Tip: Start with the AI Generator to create your initial Context and Container diagrams, then refine manually. Use referenced diagrams to maintain traceability between levels, and leverage Report Composer to auto-generate architecture documentation for sprint reviews or compliance audits.
Limit elements per diagram: Aim for 5–9 items per view to avoid cognitive overload.
Use consistent naming: "User Service" not "UserService" in one diagram and "user-svc" in another.
Label relationships clearly: "sends order confirmation" > "sends message".
Group related elements: Use boundaries or color to show domains (e.g., "Billing Domain").
Include a legend: Especially when sharing with non-technical audiences.
❌ Mixing abstraction levels: Don't show code classes on a System Context diagram.
❌ Over-detailing early: Start high-level; add detail only when it adds value.
❌ Ignoring the audience: A CTO needs different detail than a backend developer.
❌ Treating diagrams as one-off artifacts: Architecture diagrams decay if not maintained.
❌ Using ambiguous arrows: Every relationship should have a clear purpose and direction.
The most effective C4 implementations allow interactive navigation:
Click a container in Level 1 to open its Level 2 diagram.
Click a component to see its Level 3 breakdown.
Link to code repositories or ADRs from elements.
Visual Paradigm excels here with its sub-diagram and referenced diagram features, enabling you to decompose complex models into smaller, manageable parts while maintaining clear navigation paths between abstraction levels. Even static exports can include hyperlinks or clear references to "see Diagram X for details".
By separating concerns by abstraction level, the C4 Model lets you tailor communication:
Executives see System Context diagrams to understand business value and integrations.
Product Managers use Container diagrams to grasp feature ownership and dependencies.
Developers drill into Components to understand implementation boundaries.
This reduces misalignment and accelerates decision-making.
Unlike monolithic UML diagrams, C4 scales gracefully:
Break a massive enterprise system into multiple Level 1 contexts.
Model each microservice as a container with its own component diagrams.
Reuse common elements (e.g., "Identity Provider") across diagrams.
The hierarchical approach prevents "diagram sprawl" while maintaining coherence.
C4 focuses on structure and responsibility, not specific frameworks. This means:
Diagrams remain valid when you refactor code or swap libraries.
Teams can adopt new technologies without redrawing entire architectures.
Discussions stay focused on architecture—not tooling debates.
The C4 Model complements agile practices:
Iterative refinement: Start with a Context diagram in sprint 0; add detail as features emerge.
Just-in-time documentation: Create Level 3 diagrams only when a component becomes complex.
Living architecture: Update diagrams as part of definition-of-done for major changes.
Architecture becomes a collaborative, evolving artifact—not a gatekeeping exercise.
| Aspect | C4 Model | UML |
|---|---|---|
| Learning curve | Low (4 element types) | Steep (14+ diagram types) |
| Audience focus | Tailored views per stakeholder | Often one-size-fits-all |
| Agility | Embraces iterative, lightweight docs | Can encourage heavyweight upfront design |
| Tooling | Works with simple boxes-and-arrows | Often requires specialized tools |
When to choose C4: For agile teams prioritizing communication over formal specification.
When UML may fit: For safety-critical systems requiring rigorous, standardized modeling.
ArchiMate is an enterprise architecture framework focused on business-IT alignment, with complex layers (Business, Application, Technology). C4 is software-centric and simpler.
Use ArchiMate for enterprise-wide strategy, capability mapping, and governance.
Use C4 for designing and communicating specific software systems.
They can complement each other: ArchiMate for the 30,000-foot view, C4 for the 300-foot view.
Informal sketches are great for whiteboard sessions but lack:
Consistent notation
Hierarchical structure
Maintainability
C4 provides just enough structure to make sketches reusable and shareable without bureaucracy.
✅ You need to explain architecture to mixed audiences
✅ Your system is too complex for a single diagram
✅ You want diagrams that evolve with your code
✅ You value clarity over formal completeness
❌ You need legally binding specification documents
❌ Your team is already proficient with UML/ArchiMate and satisfied
❌ You're modeling non-software systems (e.g., business processes alone)
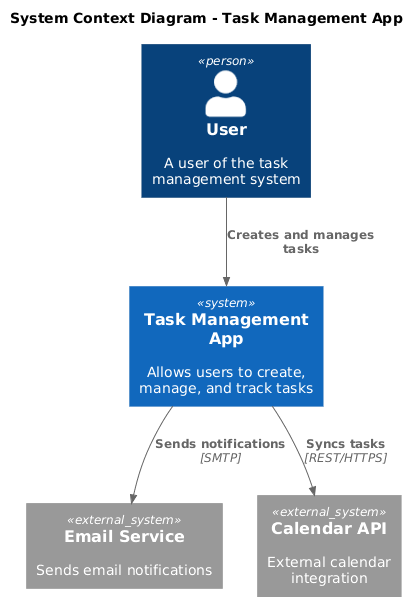
System: Task Management App
Level 1 (Context): Shows Users, Task App, Email Service, Calendar API.
Level 2 (Containers): React Frontend, Node.js API, PostgreSQL DB, Redis Cache.
Level 3 (Components): Inside API: AuthController, TaskService, NotificationEngine.
Level 4 (Code): Auto-generated class diagram for TaskService using Visual Paradigm's AI tools.
Outcome: New developers onboard faster; product team understands integration points.
Here are the complete C4 PlantUML diagrams for the Task Management Application example from the article:
@startuml
!include https://raw.githubusercontent.com/plantuml-stdlib/C4-PlantUML/master/C4_Container.puml

title System Context Diagram - Task Management App

Person(user, "User", "A user of the task management system")
System_Ext(emailService, "Email Service", "Sends email notifications")
System_Ext(calendarApi, "Calendar API", "External calendar integration")

System(taskApp, "Task Management App", "Allows users to create, manage, and track tasks")

Rel(user, taskApp, "Creates and manages tasks")
Rel(taskApp, emailService, "Sends notifications", "SMTP")
Rel(taskApp, calendarApi, "Syncs tasks", "REST/HTTPS")

@enduml
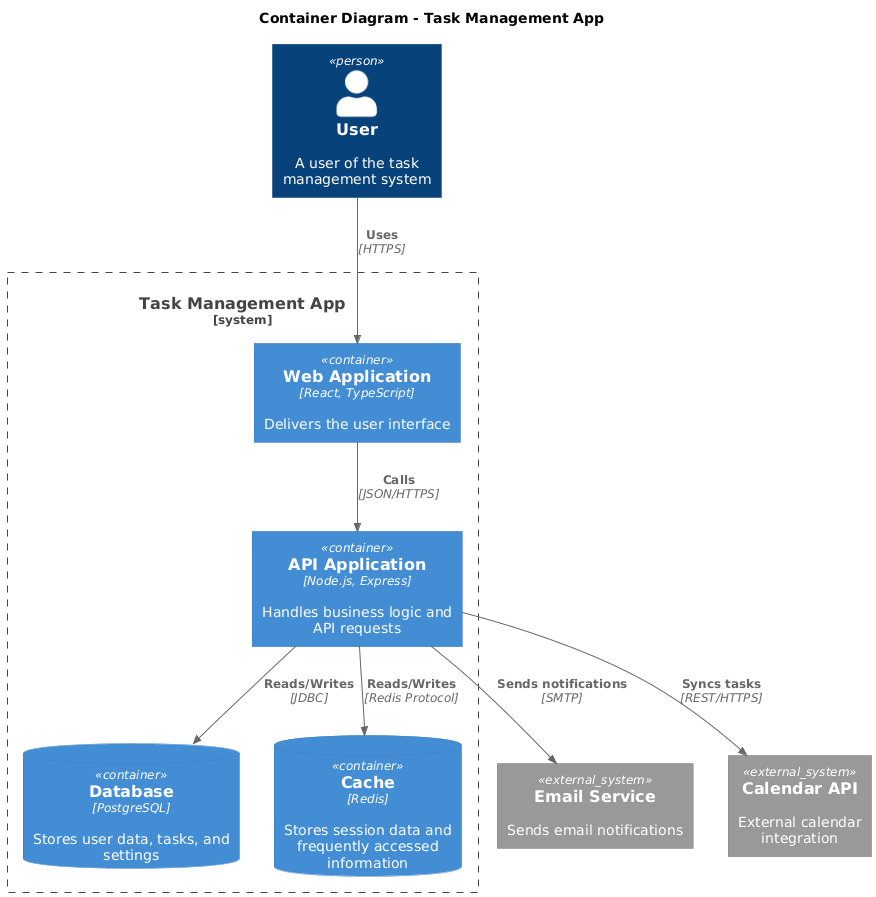
@startuml
!include https://raw.githubusercontent.com/plantuml-stdlib/C4-PlantUML/master/C4_Container.puml

title Container Diagram - Task Management App

Person(user, "User", "A user of the task management system")

System_Boundary(taskApp, "Task Management App") {
    Container(webApp, "Web Application", "React, TypeScript", "Delivers the user interface")
    Container(apiApp, "API Application", "Node.js, Express", "Handles business logic and API requests")
    ContainerDb(database, "Database", "PostgreSQL", "Stores user data, tasks, and settings")
    ContainerDb(cache, "Cache", "Redis", "Stores session data and frequently accessed information")
}

System_Ext(emailService, "Email Service", "Sends email notifications")
System_Ext(calendarApi, "Calendar API", "External calendar integration")

Rel(user, webApp, "Uses", "HTTPS")
Rel(webApp, apiApp, "Calls", "JSON/HTTPS")
Rel(apiApp, database, "Reads/Writes", "JDBC")
Rel(apiApp, cache, "Reads/Writes", "Redis Protocol")
Rel(apiApp, emailService, "Sends notifications", "SMTP")
Rel(apiApp, calendarApi, "Syncs tasks", "REST/HTTPS")

@enduml
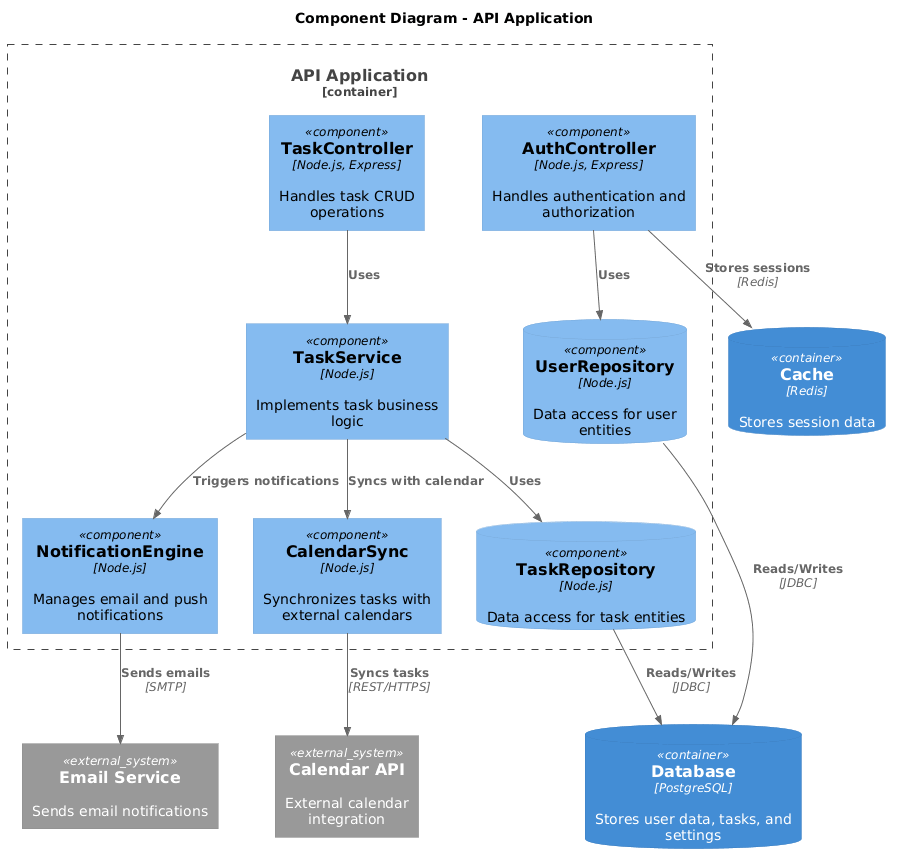
@startuml
!include https://raw.githubusercontent.com/plantuml-stdlib/C4-PlantUML/master/C4_Component.puml

title Component Diagram - API Application

Container_Boundary(apiApp, "API Application") {
    Component(authController, "AuthController", "Node.js, Express", "Handles authentication and authorization")
    Component(taskController, "TaskController", "Node.js, Express", "Handles task CRUD operations")
    Component(taskService, "TaskService", "Node.js", "Implements task business logic")
    Component(notificationEngine, "NotificationEngine", "Node.js", "Manages email and push notifications")
    Component(calendarSync, "CalendarSync", "Node.js", "Synchronizes tasks with external calendars")
    ComponentDb(userRepo, "UserRepository", "Node.js", "Data access for user entities")
    ComponentDb(taskRepo, "TaskRepository", "Node.js", "Data access for task entities")
}

ContainerDb(database, "Database", "PostgreSQL", "Stores user data, tasks, and settings")
ContainerDb(cache, "Cache", "Redis", "Stores session data")
System_Ext(emailService, "Email Service", "Sends email notifications")
System_Ext(calendarApi, "Calendar API", "External calendar integration")

Rel(authController, userRepo, "Uses")
Rel(taskController, taskService, "Uses")
Rel(taskService, taskRepo, "Uses")
Rel(taskService, notificationEngine, "Triggers notifications")
Rel(taskService, calendarSync, "Syncs with calendar")
Rel(notificationEngine, emailService, "Sends emails", "SMTP")
Rel(calendarSync, calendarApi, "Syncs tasks", "REST/HTTPS")
Rel(userRepo, database, "Reads/Writes", "JDBC")
Rel(taskRepo, database, "Reads/Writes", "JDBC")
Rel(authController, cache, "Stores sessions", "Redis")

@enduml
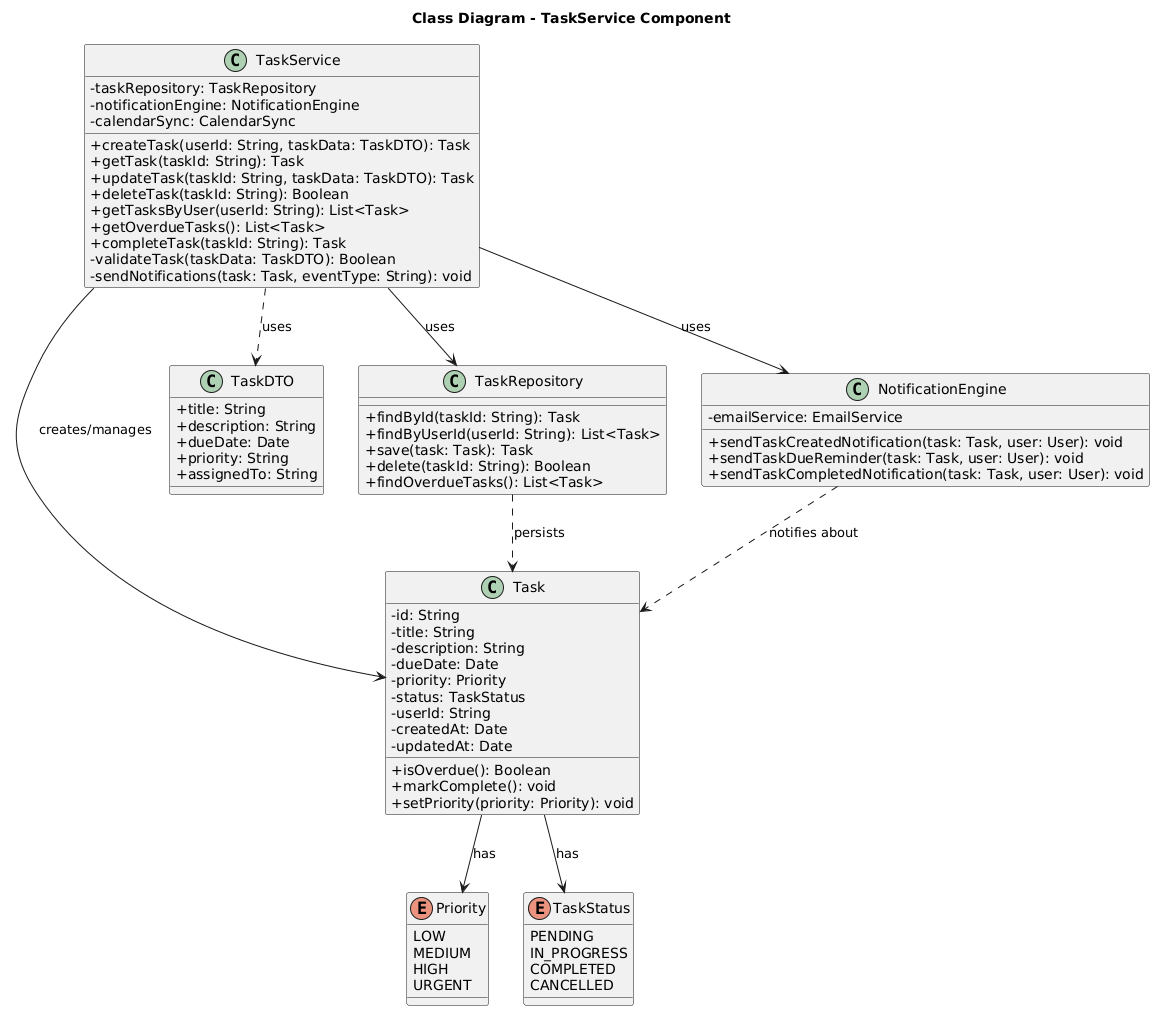
@startuml
title Class Diagram - TaskService Component

skinparam classAttributeIconSize 0

class TaskService {
    - taskRepository: TaskRepository
    - notificationEngine: NotificationEngine
    - calendarSync: CalendarSync

    + createTask(userId: String, taskData: TaskDTO): Task
    + getTask(taskId: String): Task
    + updateTask(taskId: String, taskData: TaskDTO): Task
    + deleteTask(taskId: String): Boolean
    + getTasksByUser(userId: String): List<Task>
    + getOverdueTasks(): List<Task>
    + completeTask(taskId: String): Task
    - validateTask(taskData: TaskDTO): Boolean
    - sendNotifications(task: Task, eventType: String): void
}

class Task {
    - id: String
    - title: String
    - description: String
    - dueDate: Date
    - priority: Priority
    - status: TaskStatus
    - userId: String
    - createdAt: Date
    - updatedAt: Date

    + isOverdue(): Boolean
    + markComplete(): void
    + setPriority(priority: Priority): void
}

enum Priority {
    LOW
    MEDIUM
    HIGH
    URGENT
}

enum TaskStatus {
    PENDING
    IN_PROGRESS
    COMPLETED
    CANCELLED
}

class TaskDTO {
    + title: String
    + description: String
    + dueDate: Date
    + priority: String
    + assignedTo: String
}

class TaskRepository {
    + findById(taskId: String): Task
    + findByUserId(userId: String): List<Task>
    + save(task: Task): Task
    + delete(taskId: String): Boolean
    + findOverdueTasks(): List<Task>
}

class NotificationEngine {
    - emailService: EmailService

    + sendTaskCreatedNotification(task: Task, user: User): void
    + sendTaskDueReminder(task: Task, user: User): void
    + sendTaskCompletedNotification(task: Task, user: User): void
}

TaskService --> TaskRepository : uses
TaskService --> NotificationEngine : uses
TaskService --> Task : creates/manages
TaskService ..> TaskDTO : uses
Task --> Priority : has
Task --> TaskStatus : has
TaskRepository ..> Task : persists
NotificationEngine ..> Task : notifies about

@enduml
Install PlantUML or use an online editor like PlantText or Kroki
Include the C4-PlantUML library (already included in the diagrams via the !include directive)
Render the diagrams by pasting the code into your PlantUML editor
Customize the diagrams by:
Adding more components or relationships
Modifying colors and styles
Adding metadata and tags
These diagrams follow the C4 Model principles outlined in the article and provide a complete hierarchical view from system context down to code-level details.
System: E-Commerce Platform (15+ microservices)
Level 1: Single "E-Commerce System" box with external partners (Payment, Shipping).
Level 2: Each microservice as a container (Order Service, Inventory Service, etc.), plus API Gateway and Service Mesh.
Level 3: Drill into Order Service to show OrderValidator, PricingEngine, SagaOrchestrator.
Deployment Overlay: Visual Paradigm Deployment Diagram shows services running in Kubernetes pods across AWS regions.
Outcome: Ops team uses diagrams for incident response; architects identify coupling risks.
System: Bank Loan Processing System (legacy + modern)
Level 1: Loan System interacting with Core Banking, Credit Bureau, CRM, Regulatory Reporting.
Level 2: Mix of containers: Modern Spring Boot services, legacy COBOL batch jobs, Kafka event streams.
Level 3: Component diagram for "Risk Assessment Service" showing rule engine integration.
ADR Links: Each major component links to Architecture Decision Records explaining technology choices, managed within Visual Paradigm's project repository.
Outcome: Regulatory auditors understand data flows; modernization team prioritizes refactoring targets.
Combine C4 diagrams with Risk Storming workshops:
Draw a Container or Component diagram in Visual Paradigm.
Have team members anonymously tag elements with risks (security, scalability, single point of failure).
Discuss and prioritize mitigation strategies.
This turns architecture diagrams into proactive risk management tools.
Enhance C4 diagrams by linking elements to Architecture Decision Records (ADRs):
In Visual Paradigm, attach ADR documents to containers or components using element properties or hyperlinks.
Each ADR explains why a technology or pattern was chosen.
New team members understand not just what exists, but why.
Visual Paradigm's Report Composer can then generate consolidated architecture documentation that includes both diagrams and decision rationale.
Make diagrams part of your workflow:
Definition of Done: Update relevant C4 diagrams when adding major features.
Pull Requests: Require diagram updates for architecture-impacting changes.
CI/CD: Use Visual Paradigm's command-line interface or API to auto-generate Level 4 diagrams from code; validate diagram-code consistency in pipeline checks.
Onboarding: Use C4 views exported as interactive HTML (via Project Publisher) as primary orientation material for new hires.
Adapt C4 for modern architectures using Visual Paradigm's cloud architecture tooling:
Cloud: Tag containers with AWS/Azure/GCP service icons (Visual Paradigm includes dedicated cloud symbol libraries).
Serverless: Treat functions as components; show event sources (SQS, EventBridge) as relationships.
Distributed Systems: Use Deployment Diagrams to show regions, availability zones, and data replication.
Observability: Add elements for monitoring (Prometheus), logging (ELK), and tracing (Jaeger) using custom shapes or tags.
The model's flexibility, combined with Visual Paradigm's extensive symbol libraries, lets you represent cloud-native patterns without losing clarity.
Identify your system boundary: What are you modeling? (e.g., "Customer Portal")
Draw Level 1 (Context) in Visual Paradigm:
List user roles and external systems.
Use the C4 System Context template; sketch your system as one box; connect with labeled arrows.
Select one container to detail: Start with the most complex or critical.
Draw Level 2 (Containers):
Break your system into deployable units using Visual Paradigm's Container diagram template.
Label technologies and key responsibilities.
Drill into one container for Level 3:
Right-click the container → Create Sub-Diagram → Component Diagram.
Identify 3–7 major components; show interfaces and dependencies.
Review with stakeholders: Use Visual Paradigm's real-time collaboration or export to PDF for feedback.
Store and maintain: Save projects in Visual Paradigm's centralized repository with version control; assign ownership.
Time estimate: 2–4 hours for a first pass on a medium-complexity system. With Visual Paradigm's AI Generator, initial drafts can be created in minutes.
Official C4 Site: c4model.com – Reference guide, examples, templates
Book: Software Architecture for Developers by Simon Brown
Visual Paradigm Resources:
C4 Diagram Tool Overview: visual-paradigm.com/features/c4-diagram-tool
AI C4 Generator Announcement: updates.visual-paradigm.com
C4 Templates Gallery: online.visual-paradigm.com/diagrams/templates/c4-model
Community:
Visual Paradigm User Community for sharing C4 designs
r/softwarearchitecture on Reddit
The C4 Model thrives on community contribution:
Contribute examples or tool integrations on GitHub.
Share lessons learned in blog posts or conference talks.
Participate in Visual Paradigm's community forums to exchange C4 modeling tips.
Simon Brown and the community actively maintain the C4 specification, while Visual Paradigm ensures its tooling evolves in lockstep with industry practices and C4 best practices .
The C4 Model provides a simple, hierarchical way to visualize software architecture at four levels: Context, Containers, Components, and Code.
It prioritizes communication over completeness, tailoring detail to the audience.
By embracing "just enough" design, it aligns with agile values and reduces documentation waste.
With Visual Paradigm's native C4 support, AI-powered generation, and team collaboration features, diagrams become living artifacts that evolve with your system.
It complements—not replaces—other practices like ADRs, risk assessment, and DevOps workflows.
As systems grow more distributed and teams more remote, clear architecture communication becomes more critical—not less. The C4 Model's simplicity, flexibility, and focus on human understanding position it well for the future. Emerging trends like AI-assisted diagram generation—already available in Visual Paradigm—and real-time collaboration will continue to enhance C4 tooling—but the core philosophy will remain: diagrams should serve people, not paperwork.
Start small. Draw one Context diagram this week using Visual Paradigm's free online tier. Share it. Iterate. You'll soon discover why thousands of teams worldwide have made the C4 Model their architecture communication standard.
Person: A human actor interacting with the system (e.g., "End User", "Administrator").
Software System: The highest-level boundary of the solution being modeled.
Container: A deployable unit (application, data store, microservice) that executes code or stores data.
Component: A modular, encapsulated unit of functionality within a container.
Relationship: A directional interaction between elements, labeled with protocol and purpose.
View: A specific diagram at one C4 level, tailored to an audience.
Model: The complete set of elements, relationships, and views describing a system.
LEVEL 1: SYSTEM CONTEXT
[Person] --> (Software System) --> [External System]
Labels: "uses", "sends data to", "receives updates from"

LEVEL 2: CONTAINERS
(Software System) contains:
  [Web App] --HTTPS/JSON--> [API App] --JDBC--> [(Database)]
Tags: technology, responsibility

LEVEL 3: COMPONENTS
[API App] contains:
  <Auth Controller> --> <User Service> --> <Data Access>
Interfaces: defined contracts between components

VISUAL PARADIGM SHORTCUTS:
• New C4 Diagram: Diagram → New → Search "C4"
• Create Sub-Diagram: Right-click element → Create Sub-Diagram
• AI Generate: Tools → AI Diagram Generator → Enter description
• Export: File → Export → PNG/PDF/HTML
• Collaborate: Share project link for real-time editing
Access ready-to-use C4 templates directly in Visual Paradigm:
System Context Template: Pre-styled with Person, System, and External System shapes
Container Diagram Template: Includes technology tags and deployment hints
Component Diagram Template: With interface notation and dependency styling
Deployment Diagram Template: Cloud infrastructure icons and environment boundaries
AI-Generated Starter Kits: Describe your system in natural language and let Visual Paradigm's AI generate a complete C4 suite [
Get started free: Visit online.visual-paradigm.com to create your first C4 diagram with no registration required