A Gantt chart is a type of horizontal bar chart commonly used in project management, which is a visual view of tasks scheduled overtime. It provides a graphical visualization of a schedule that helps to plan, coordinate, and track specific tasks (or elements) in a project.
A Gantt chart shows the start and finishes dates of several elements of a project which could be tasks, but also other types of elements, i.e. resources, milestones, tasks, and dependencies. Each bar represents an element of a project, with the length of the bar for describing the amount of time that elements will take, that gives teams an overview of what task needs to get done, who’s responsible for it, and when they should be completed. Modern Gantt charts also show the dependency relationships between activities and current schedule status. There a quite a number of advantages for using Gannt in project management which includes:
The following table shows the tasks, dependencies, and estimated times a project manager might input to a basic GANTT chart for a software development project.
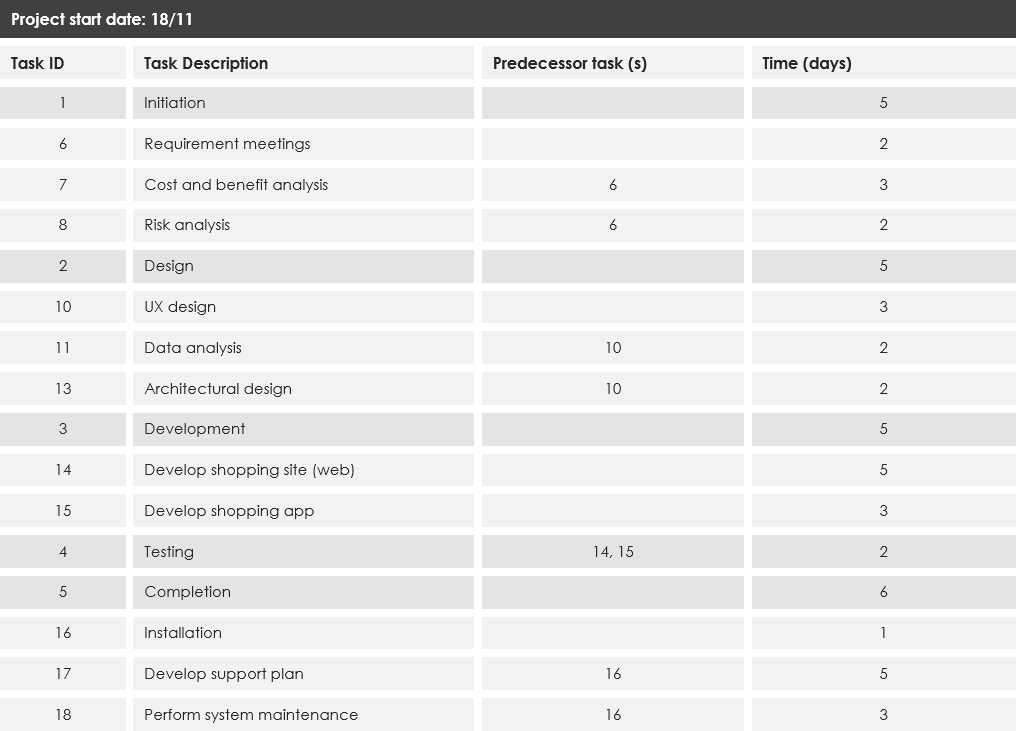
Note that Tasks 11 and 13 all require Task 10 to be completed, and have no other dependencies, so these all start on the same date.
The chart below show all seven days of the week, but often, weekend days are excluded. Now that your tasks are all in place in the table above, along with their corresponding dates and duration, it's time to create a Gantt chart:

With Visual Paradigm, you can Keep the development activities in Tasifier, an agile friendly task management tool. Tasifier keeps your tasks, related artifacts and the discussion among developers in one single platform.

Your team can also interrelate the Gantt chart and Tasifier by synchronizing them. Changes you made in any side will instantly reflect in the other side, which provides a significant advantage for you to understand the tasks being managed from different angles.
