Velocity is an extremely simple, powerful method for accurately measuring the rate at which scrum development teams consistently deliver business value. It is an indication of the average amount of Product Backlog turned into an Increment of product during a Sprint by a Scrum Team, tracked by the Development Team for use within the Scrum Team. Thus, to calculate velocity of your agile team, simply add up the estimates of the features, user stories, requirements or backlog items successfully delivered in an iteration. It should the team:
Best Scrum Software Every Project Needs
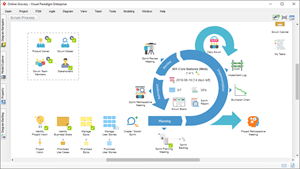
A powerful scrum software that supports scrum project management. It features scrum tools like user story map, product backlog management, sprint backlog management, task management, daily scrum meeting, sprint planning tool, sprint review tool, sprint retrospective tool, burndown, impediment, stakeholder and team management.
There are some simple guidelines for estimating initial velocity of your Scrum team prior to completing the first few iterations, but after that point your team could use proven, historical measures of velocity estimation for sprint planning. Based on a series of past sprints, the estimation of velocity typically stabilizes and provides a more reliable basis for improving the accuracy of both short-term and longer-term planning of your Scrum projects.
Note That:
Velocity is a measure of the amount of work a Team can tackle during a single Sprint and is the key metric in Scrum. Velocity is calculated at the end of the Sprint by summing up the Points for all fully completed User Stories. Points from partially-completed or incomplete stories should not be counted in calculating velocity.
Step1 – Calculate the Velocity of the First iteration (Sprint)
At the end of each iteration, the team adds up effort estimates associated with user stories that were completed during that iteration. This total is called velocity.
An agile team has started work on an iteration, planning to complete stories A and B, estimated at 2 points each, and story C, estimated at 3 points. At the end of the iteration, stories A and B are 100% complete but C is only 80% complete. Agile teams generally acknowledge only two levels of completion, 0% done or 100% done. Therefore, C is not counted toward velocity, and velocity as of that iteration is 4 points.
Step 2 – Use the Velocity to estimate number of iteration needed
After knowing velocity in step 1, the team can compute (or revise) an estimate of how long the project will take to complete, based on the estimates associated with remaining user stories and assuming that velocity over the remaining iterations will remain approximately the same. This is generally an accurate prediction, even though rarely a precise one.
Suppose the user stories remaining represent a total of 40 points; the team's forecast of the remaining effort for the project is then 10 iterations.
Story points are used to measure size and complexity which mean how long it takes us to finish it. Story point is a relative measure of the time it takes to complete a user story. It is a concept borrowed from XP. It is used to assess the difficulty of the story, not the promise of how long it will take. This is regardless of the size of the team or what is the task, you can use story points.
How to relate velocity to story point?
Story points are a relative measurement unit, the first step your team should take is to define one story as the baseline, so that they can estimate the other stories comparing to that reference. According to the literature, the team should find the simplest story in the backlog, and assign 1 story point to it, after that, they use that story as baseline to estimate the other stories.
There are two types of scales used for creating estimation of user story point:
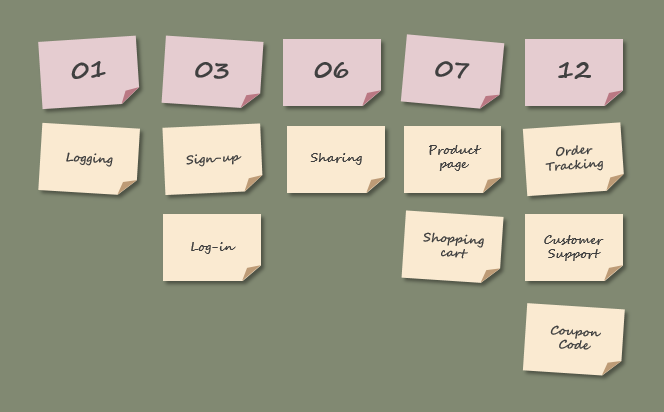
It is a good idea to estimate the first user story that your team is familiar and should know how much time needed for the story to be completed. Then you estimate you’re the next user story. If your team decides it is smaller than the baseline user story, so you place it on the left side of the baseline story. Then you estimate again another user story. Support the team decides that it is also smaller than the baseline story, but bigger than the second story – so you place the third story in the middle of the baseline user story and the second user story. In this example, we use Fibonacci sequence numbers for story estimation:
In Scrum, velocity help you to understand how long it will take your team to complete the product backlog. However, it typically takes few sprints for the team figure out a more stable velocity. To estimate more accurate velocity for your team, we can gain the experience based on the past track-record of the team. It will be more accurately forecasting of how many stories a Team can do in a Sprint. For forecasting purposes the average of the last three or four Sprint's Velocity should be used.
Suppose the new Scrum Team planned to complete 41 story points in their very first sprint. They eventually can only completed 38 story points, and rolled 6 story points over to the next sprint. So their velocity is 38 as shown in the Figure below:
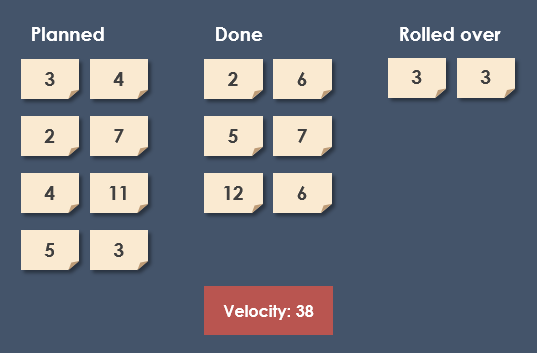
As mentioned before, the team should not add any partially-completed work towards the velocity. Only those user stories marked as ‘Done’ count, even if there’s only a tiny bit of work left to do in the task.
Based on just only one sprint, the velocity is not a very reliable metric for making predictions. (But it does give the team a sense of how much work they can commit to in a single sprint.) Let’s track their progress for a few more sprints.
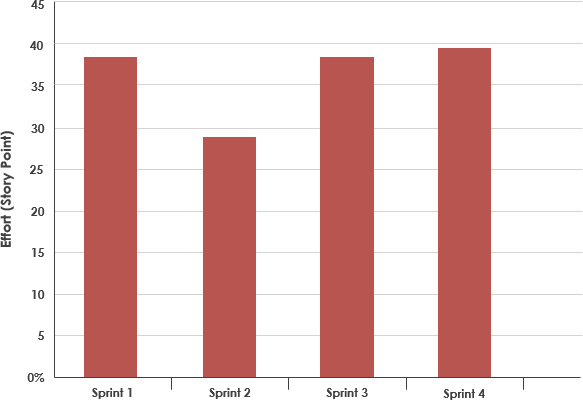
Now, the new team continuous the subsequently development from Sprint 1 – 4 and the story points in their first sprint is 38, 29 in their second, 38 in their third, and 39 in their fourth. So the estimation average of velocity after 4 sprints is 36 as shown the Figure below:
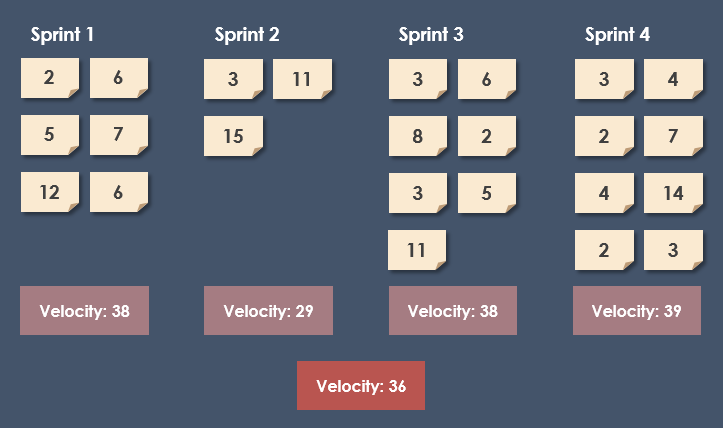
This average, over just four sprints, is already much more useful than the snapshot we had after just one sprint. It’s easy to imagine how, with a backlog of already-estimated user stories, we could use this velocity to make predictions. We could predict how quickly the team could get through all the work. And we could make educated guesses about what features we’d be able to deliver in upcoming releases.
If a Scrum team has completed multiple sprints, the team can forecast release and product completion dates and plan future projects more accurately by reviewing the velocity report. Based on the velocity of previous sprints that the report illustrates, you can accomplish the following goals:
Based on the example above, a velocity graph shows the amount of effort that the Scrum team has reported as complete for each sprint of the 4 Sprints completed:
| About Visual Paradigm |
 Visual Paradigm help organizations stay competitive and responsive to change faster and better in today’s fast changing environment. Our award-winning products are trusted by over 320,000 users in companies ranging from small business, consultants, to blue chip organizations, universities and government units across the globe. It enables organizations to improve business and IT agility and foster innovation through popular open standards and process frameworks.Visual Paradigm, a killer Agile feature in 2018, introduced Scrum Process Canvas for automating the way a Scrum team to create, manage and deploy software application that empowers the team to continuously improve their performance at unprecedented speed and scale. Visual Paradigm help organizations stay competitive and responsive to change faster and better in today’s fast changing environment. Our award-winning products are trusted by over 320,000 users in companies ranging from small business, consultants, to blue chip organizations, universities and government units across the globe. It enables organizations to improve business and IT agility and foster innovation through popular open standards and process frameworks.Visual Paradigm, a killer Agile feature in 2018, introduced Scrum Process Canvas for automating the way a Scrum team to create, manage and deploy software application that empowers the team to continuously improve their performance at unprecedented speed and scale.
Manage the Entire Scrum Process in One Page
|