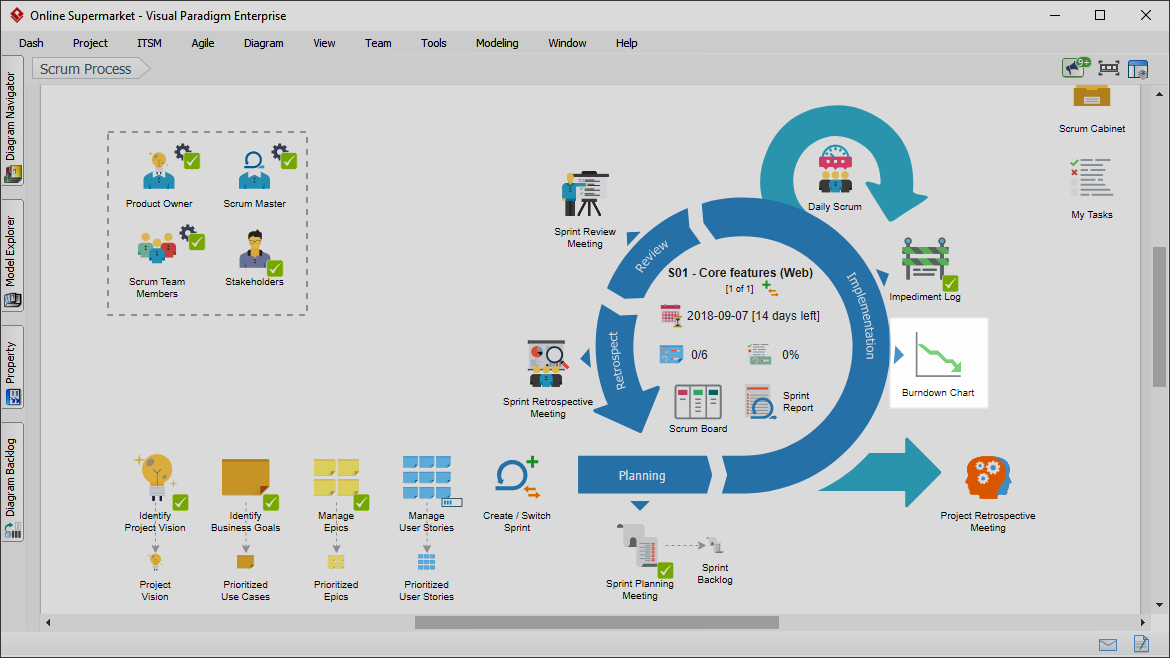
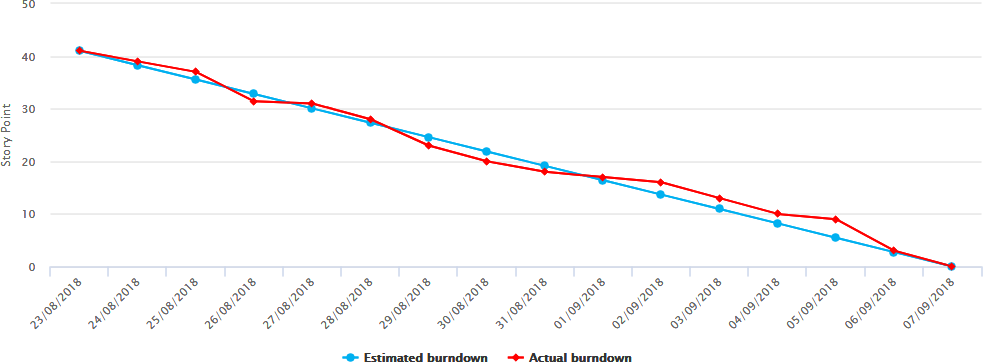
A burndown chart is a graphical representation of the amount of remaining work versus time. The initial burndown chart consists of an estimated burndown derived by the estimated effort of sprint tasks. At the end of each day, the burndown chart is updated to reflect the remaining amount of work.
Burndown chart reflects the progress of a project. It allows for the detection of estimates that may have been incorrect. If the burndown chart shows that the scrum team is behind schedule, the scrum master should identify and remove any obstacles or impediments to successful completion.
Perform the steps below to open the burndown chart. You may try the steps interactively by visiting the interactive product tour.