Flowchart Tutorial (with Symbols, Guide and Examples)

A flowchart is simply a graphical representation of steps. It shows steps in sequential order and is widely used in presenting the flow of algorithms, workflow or processes. Typically, a flowchart shows the steps as boxes of various kinds, and their order by connecting them with arrows.

Flowchart example

What is a Flowchart?

A flowchart is a graphical representations of steps. It was originated from computer science as a tool for representing algorithms and programming logic but had extended to use in all other kinds of processes. Nowadays, flowcharts play an extremely important role in displaying information and assisting reasoning. They help us visualize complex processes, or make explicit the structure of problems and tasks. A flowchart can also be used to define a process or project to be implemented.

Flowchart Symbols

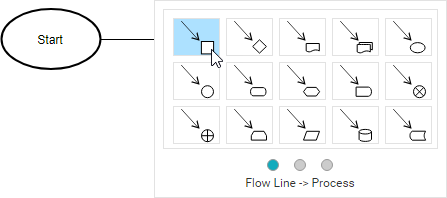
Different flowchart shapes have different conventional meanings. The meanings of some of the more common shapes are as follows:

Terminator

The terminator symbol represents the starting or ending point of the system.

Flowchart symbol: Terminator

Process

A box indicates some particular operation.

Flowchart symbol: Process

Document

This represents a printout, such as a document or a report.

Flowchart symbol: Document

Decision

A diamond represents a decision or branching point. Lines coming out from the diamond indicates different possible situations, leading to different sub-processes.

Flowchart symbol: Decision

Data

It represents information entering or leaving the system. An input might be an order from a customer. Output can be a product to be delivered.

Flowchart symbol: Data

On-Page Reference

This symbol would contain a letter inside. It indicates that the flow continues on a matching symbol containing the same letter somewhere else on the same page.

Flowchart symbol: On page reference

Off-Page Reference

This symbol would contain a letter inside. It indicates that the flow continues on a matching symbol containing the same letter somewhere else on a different page.

Flowchart symbol: Off page reference

Delay or Bottleneck

Identifies a delay or a bottleneck.

Flowchart symbol: Delay

Flow

Lines represent the flow of the sequence and direction of a process.

Flowchart symbol: Flow

When to Draw Flowchart?

Using a flowchart has a variety of benefits:

  • It helps to clarify complex processes.
  • It identifies steps that do not add value to the internal or external customer, including delays; needless storage and transportation; unnecessary work, duplication, and added expense; breakdowns in communication.
  • It helps team members gain a shared understanding of the process and use this knowledge to collect data, identify problems, focus discussions, and identify resources.
  • It serves as a basis for designing new processes.

Flowchart examples

Here are several flowchart examples. See how you can apply a flowchart practically.

Flowchart Example – Medical Service

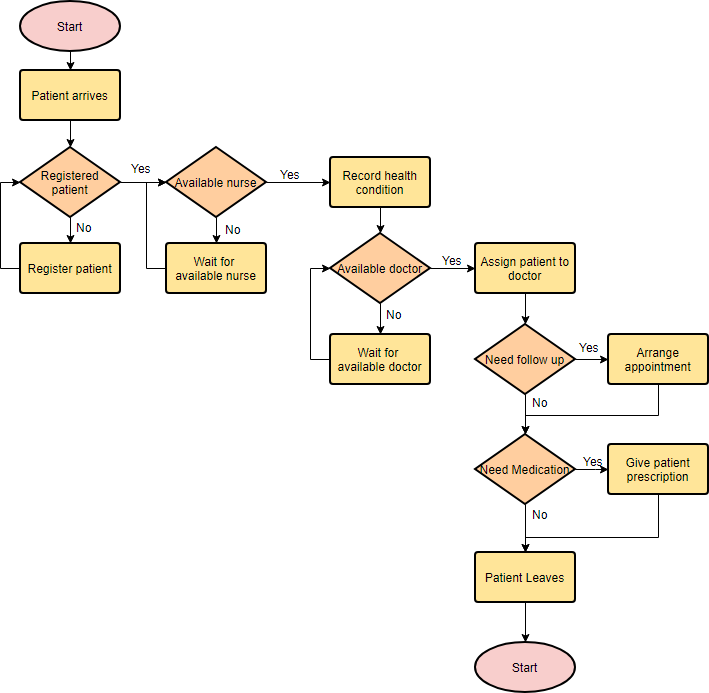
This is a hospital flowchart example that shows how clinical cases shall be processed. This flowchart uses decision shapes intensively in representing alternative flows.

Flowchart example: Medical services

Flowchart Example – Simple Algorithms

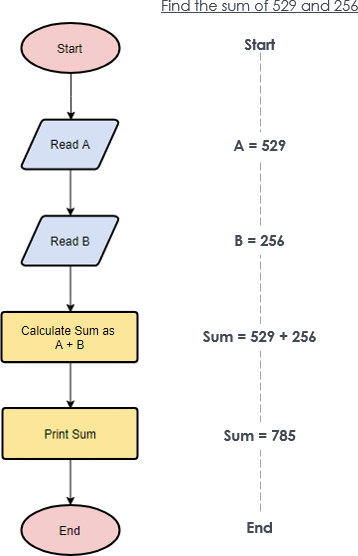
A flowchart can also be used in visualizing algorithms, regardless of its complexity. Here is an example that shows how flowchart can be used in showing a simple summation process.

Flowchart example: Simple algorithms

Flowchart Example – Calculate Profit and Loss

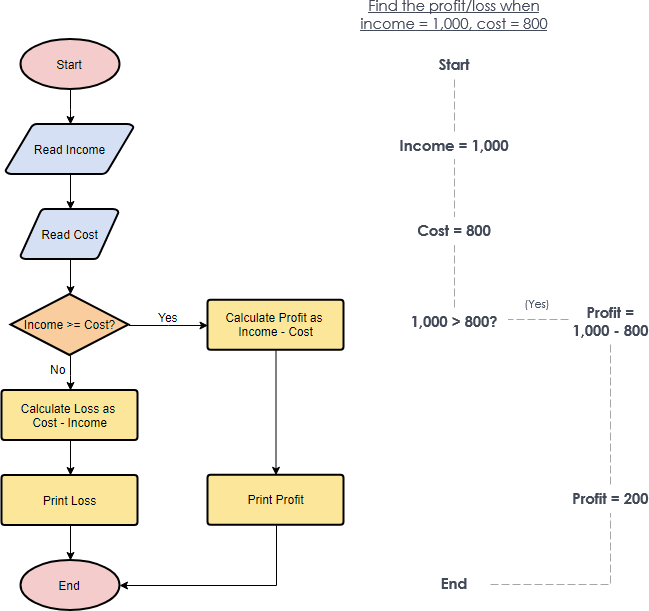
The flowchart example below shows how profit and loss can be calculated.
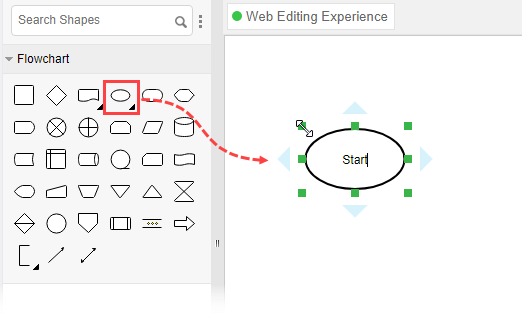
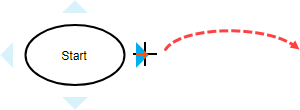
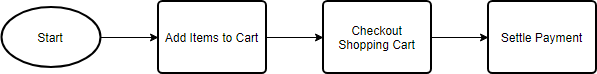
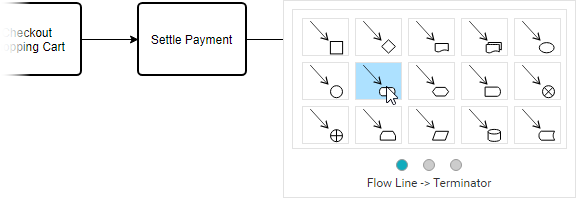
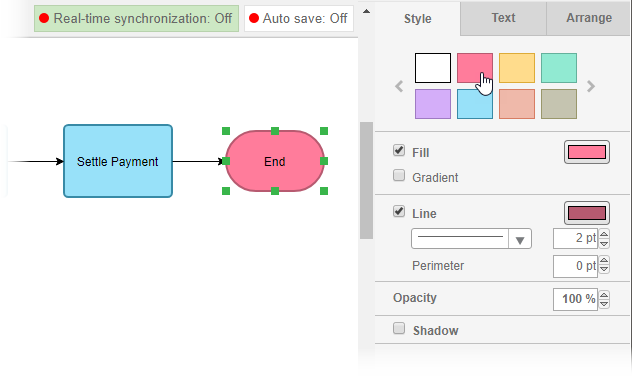
Flowchart example: Calculate profit and loss

Creating a Flowchart in Visual Paradigm

Let’s see how to draw a flowchart in Visual Paradigm. We will use a very simple flowchart example here. You may expand the example when finished this tutorial.

  1. Select Diagram > New from the main menu.
  2. In the New Diagram window, select Flowchart and click Next.
    Create flowchart
  3. You can start from an empty diagram or start from a flowchart template or flowchart example provided. Let’s start from a blank diagram. Select Blank and click Next.
    Create blank flowchart
  4. Enter the name of the flowchart and click OK.
  5. Let’s start by creating a Start symbol. Drag the Start shape from the diagram toolbar and drop it onto the diagram. Name it Start.
    Create flowchart start symbol
  6. Create the next shape. Move your mouse pointer over the start shape. Press on the triangular handler on the right and drag it out.
    Create next flowchart shape
  7. Release the mouse button. Select Flow Line > Process from the Resource Catalog.
    Select to create process
  8. Enter Add items to Cart as the name of the process.
  9. Follow the same steps to create two more processes Checkout Shopping Cart and Settle Payment.
    Create other flowchart processes
  10. End the flow by creating a terminator.
    Create terminator
    Your diagram should look like this:
    Flowchart created
  11. Color the shapes. Select Diagram > Format Panel from the main menu. Select a shape on the diagram and click update its color through the Style setting in the Format Panel.
    Format flowchart
    This is the final flowchart:
    Flowchart example complete

Turn every software project into a successful one.

We use cookies to offer you a better experience. By visiting our website, you agree to the use of cookies as described in our Cookie Policy.

OK