A Fishbone Diagram (also called Root Cause analysis) can help in brainstorming to identify possible causes of a problem and in sorting ideas into useful categories. A fishbone diagram is a visual way to look at cause and effect for identifying possible causes for a problem.
Steps to develop a Fishbone Diagram
The steps below outline the major steps to take in creating a Fishbone Diagram.
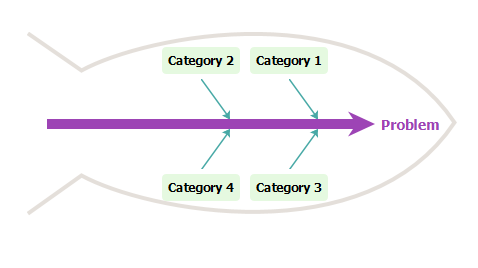
- Determine the problem statement (also referred to as the effect). This is written at the mouth of the “fish.” Be as clear and specific as you can about the problem. Beware of defining the problem in terms of a solution (e.g., we need more of something).
- Identify the major categories of causes of the problem (written as branches from the main arrow). Major categories often include: equipment or supply factors, environmental factors, rules/policy/procedure factors, and people/staff factors.
- Brainstorm all the possible causes of the problem. Ask “Why does this happen?” As each idea is given, the facilitator writes the causal factor as a branch from the appropriate category (places it on the fishbone diagram). Causes can be written in several places if they relate to several categories.
- Find out “Why does this happen?” about each cause. Write sub-causes branching off the cause branches.
- Continues to analyze “Why?” to generate deeper levels of causes and continue organizing them under related causes or categories. This will help you to identify and then address root causes to prevent future problems.
Creating a Fishbone Diagram
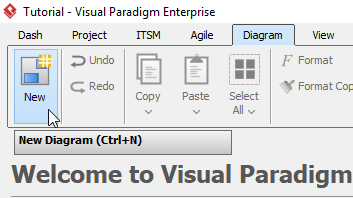
- Click Diagram > New form the toolbar.
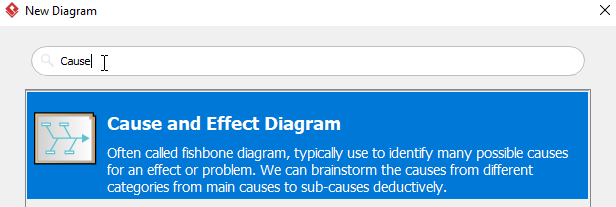
- In the New Diagram window, choose Cause and Effect Diagram (a fishbone diagram is also know as a cause and effect diagram), then click Next at the bottom of the window.
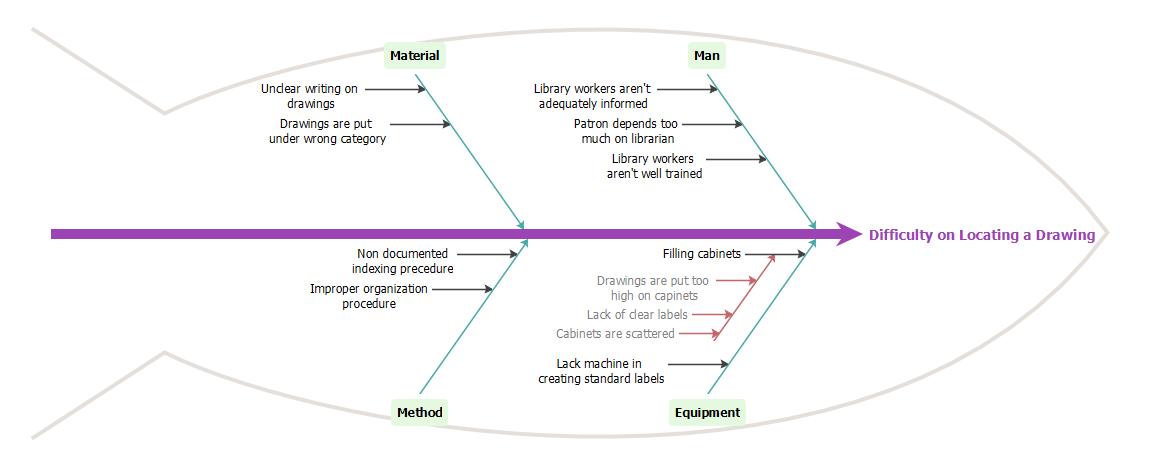
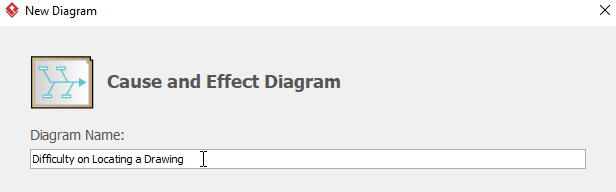
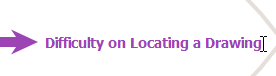
- Name the diagram (for example: Difficulty on Locating a Drawing), then click OK to finish creating a new diagram.
- You will then see something like this:
- Double click Problem on the right hand side of the diagram, then rename it. In this case, we will rename it to Difficulty on Locating a Drawing.
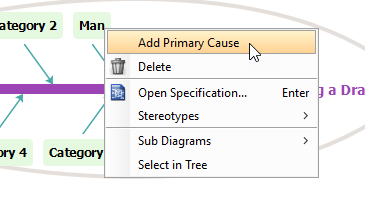
- Double click Category1 to rename it to Man, then right click Man and select Add Primary Cause from the toolbar to create a new primary cause.
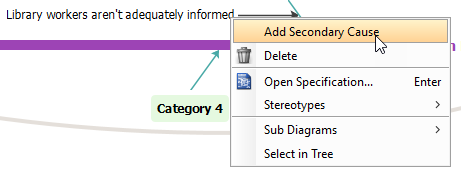
- Double click Cause and rename it to Library workers aren't adequately informed, then create a secondary cause by right clicking Library workers aren't adequately informed and select Add Secondary Cause.
- Rename the secondary cause Cause by double clicking it.
- Repeat step 5 to 8 above to create more primary and secondary causes.
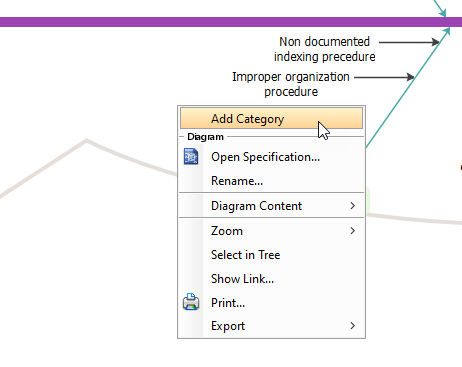
- To create a new category, right click any empty space inside the fish, then select Add Category from the toolbar.
- You will see something like this when you finish your diagram: