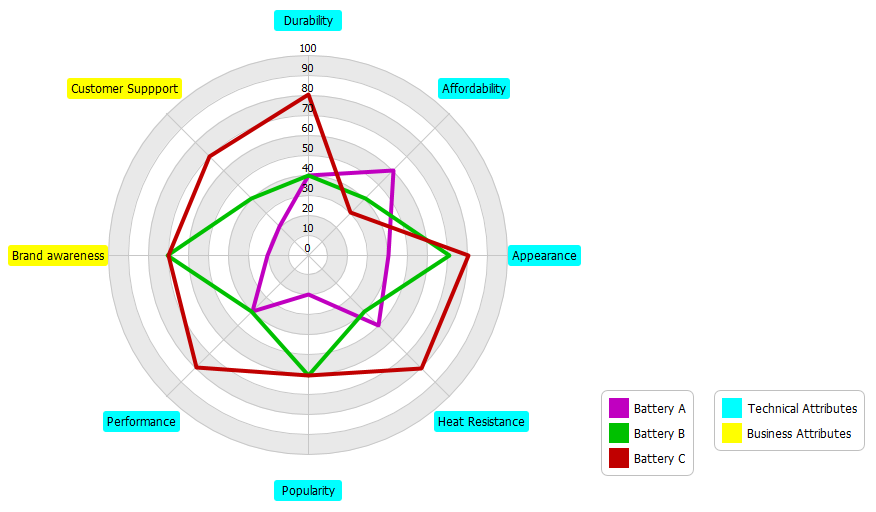
Spider graphs (also known as spider charts, or radar chart, ) are a way to visualize multivariate data which are used to plot one or more groups of values over multiple common variables represented on axes starting from the same point.
How to create a radar chart?
The steps below outline the major steps to take in creating a radar chart.
- Assign an axis to a variable
- Each of these axes are arranged radially around a central point and spaced equally.
- The data from a single observation are plotted along each axis and connected to form a polygon.
- Additional observations can be placed in a single chart by displaying multiple polygons.
- Overlay them and adjust the opacity of each polygon for each of the observations
- Examine the differences or gap among the variables for each of the observations.
Creating a radar chart
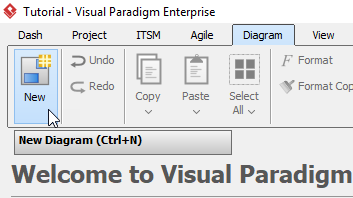
- Click Diagram > New from the toolbar.
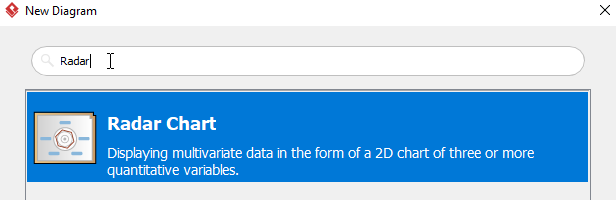
- In the New Diagram window, select Radar Chart, then click Next. You can use the search bar to filter the diagrams.
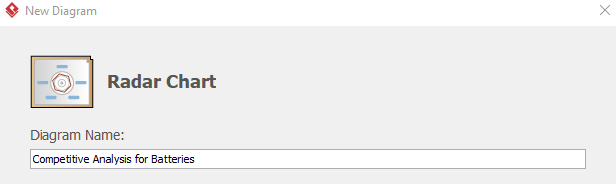
- Name the diagram, then click OK. We will be naming the diagram Competitive Analysis for Batteries in this tutorial.
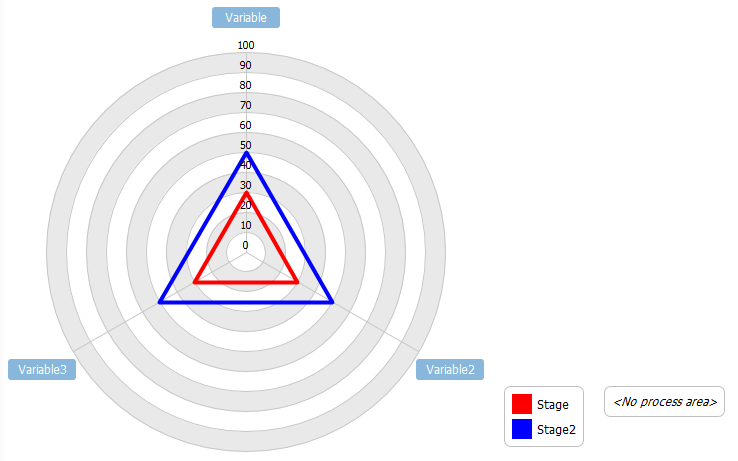
- You will see something like this:
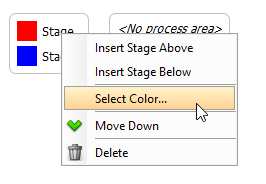
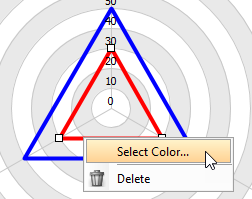
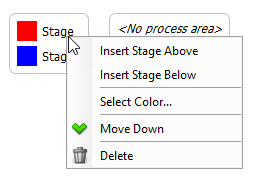
- The colors of the polygons is randomized. If you want you change the colors, you can either right click the edge of the polygon or the corresponding stage, click Select Color, then select the desired color.
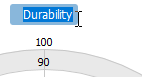
- Double click variable Variable then rename the variable to Durability.
- You can rename every variable ,stage and process area using step 6.
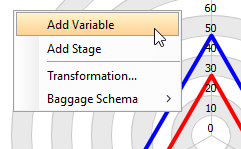
- To add a new variable, right click any empty space on the diagram, then choose Add Variable.
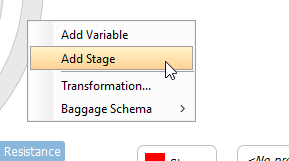
- To add a new Stage, right click any empty space then click Add Stage, or right click a stage then click Insert Stage Above/ Insert Stage Below.
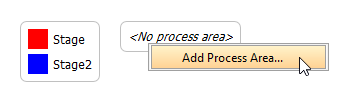
- To add a new process area, right click the schema table (Or<No process area> if there is no process area), then click Add Process Area/ Insert Process Area Above/ Insert Process Area Below.
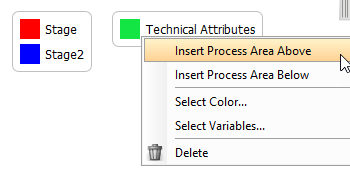
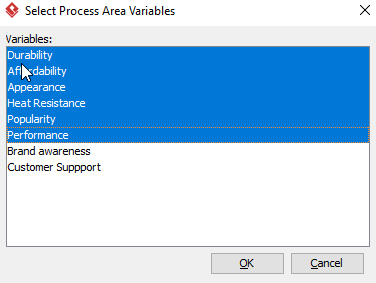
In the Select Process Area Variables window. select the variables belongs to the process area, then click OK. Multiple variables can be selected using Ctrl + Click, or Shift + Click. You can then double click the process area to rename the area.
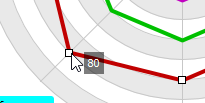
- You can move the data point to your desire position by click-dragging the point.
- You will see a similar diagram when you finish your diagram: